
Prerequisites Checklist
Before you start, confirm all three items:
| Item | What you need | Where to get it |
|---|---|---|
| Windows PC | Power BI Desktop is Windows-only. Windows 10 64-bit or later. | Your existing machine — no additional hardware needed. |
| Customer ID (CID) | A unique alphanumeric string that identifies your account on the Standard Time® cloud server. | Found in the URL after ?cid= when you open the Standard Time® web interface. |
| API Key | A long alphanumeric key that authenticates your OData requests. Sent as the X-Api-Key HTTP header. |
Generated inside Standard Time® via View → Generate API Key. See Step 2. |
stcloud67.com. If you run an on-premise installation, replace stcloud67.com in all URLs with your server's hostname or IP address. Everything else — credentials, M queries, entity paths — is identical.
?cid= parameter is only needed when connecting to the Standard Time® cloud server, where it identifies your account among many tenants. On an on-premise installation your server already knows which database to read — omit the ?cid= query string entirely. For example: http://yourserver/odata/Users rather than https://stcloud67.com/odata/Users?cid=….
Step 1 — Install Power BI Desktop
Power BI Desktop is a free Windows app. The Microsoft Store version auto-updates, which keeps the OData connector current without manual upgrades.
-
Open the Microsoft Store.
Press Win and type Microsoft Store, then press Enter. The Store opens to its home page. -
Search for Power BI Desktop.
Click the search box at the top of the Store and type Power BI Desktop. Press Enter. Select the result published by Microsoft Corporation — it should be the first result. -
Click Get (or Install).
The app is free. Click Get or Install. You may be prompted to sign in with a Microsoft account — a free personal account is sufficient for local use. Installation takes 2–5 minutes depending on your connection. -
Launch Power BI Desktop.
After installation, click Open in the Store, or find Power BI Desktop in the Start menu. Dismiss any splash screen or sign-in prompt — a blank report canvas will appear. You are ready for Step 2.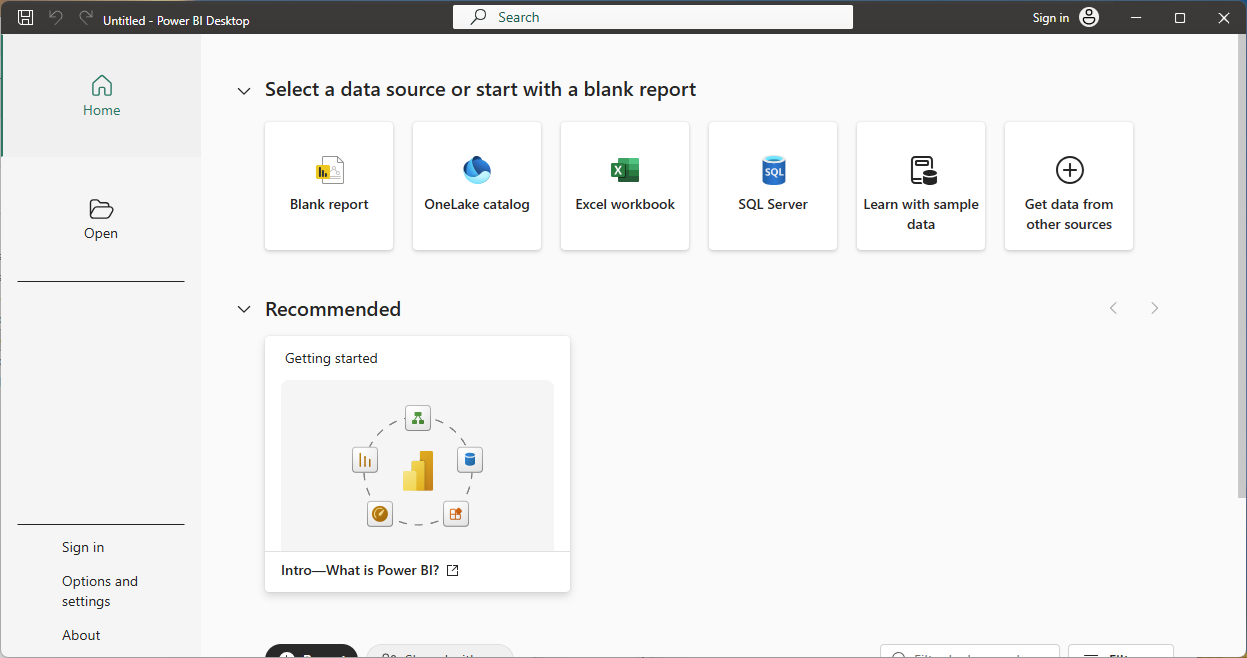
Step 2 — Get Your CID and API Key
Every OData request requires two pieces of information: your Customer ID (CID) passed in the URL, and your API Key passed in the request header. Collect both before you open Power BI.
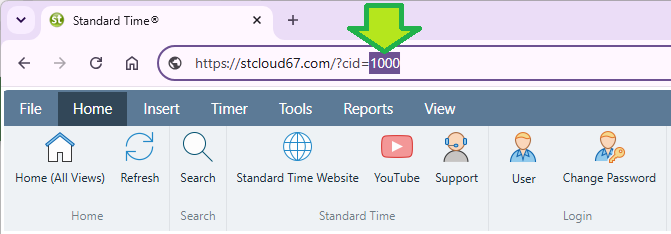
Finding your CID
Your CID is the unique identifier that tells the OData server which Standard Time® account to read from. The OData URL pattern is:
https://stcloud67.com/?cid=YOUR_CID_HERE
To find your CID:
- Log into the Standard Time® web interface — the CID appears after
?cid=in the browser address bar. - If you are not sure, ask your Standard Time® administrator.
Generating your API Key
The API key authenticates your OData requests without exposing your login credentials. Generate it once inside Standard Time® and reuse it across all your Power BI queries.
-
Open the Tools ribbon → Integration dropdown → OData API Key.
In the top ribbon, click the Tools tab. In the Integration panel, click the Integration dropdown and choose OData API Key.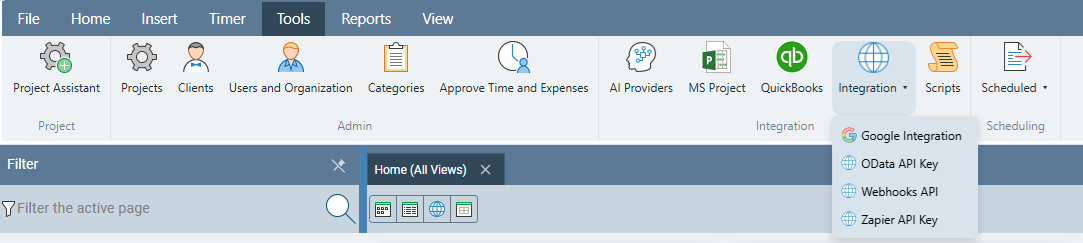
-
Generate and copy the key.
The dialog shows your current key. If none exists yet, click Generate. Click the key string to select it, then press Ctrl+C to copy. Paste it somewhere safe — a text file or password manager — before closing this dialog.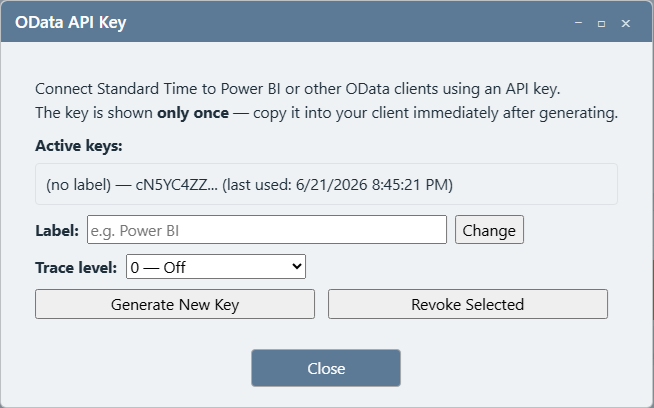
Step 3 — Open the Power Query Editor
You will enter the smoke-test M query in the Power Query Advanced Editor. Here is how to get there from a blank report.
-
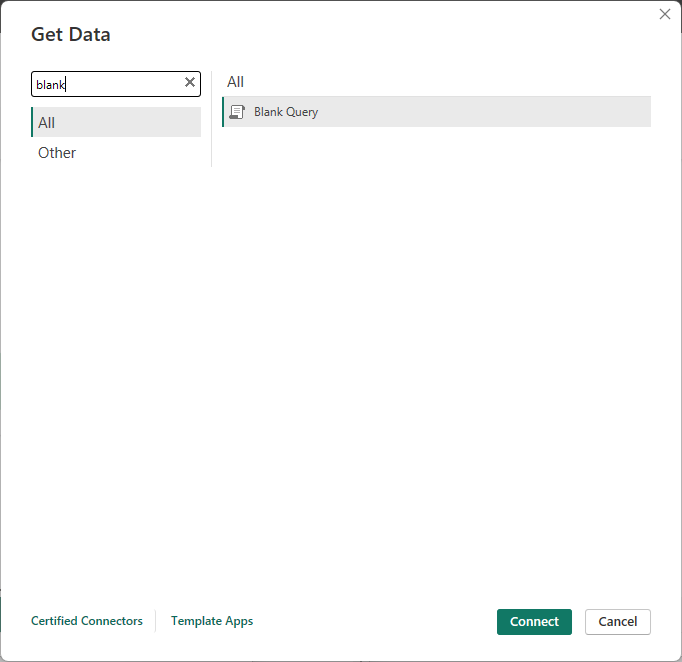
On the Home ribbon, click Get Data → Blank Query.
In Power BI Desktop, click the Home tab. Click the small dropdown arrow on Get Data. In the menu that opens, look under New Source for Blank Query — or choose More… to open the full connector list and select Blank Query there.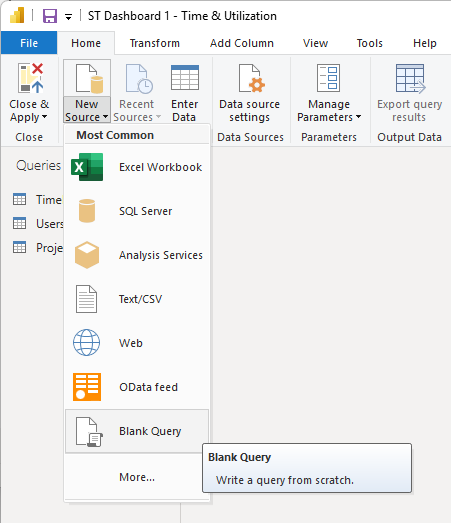
-
The Power Query Editor opens with Query1.
A new window appears — the Power Query Editor. You will see Query1 in the Queries pane on the left. The main area shows an empty preview. This is where you will paste the smoke-test query.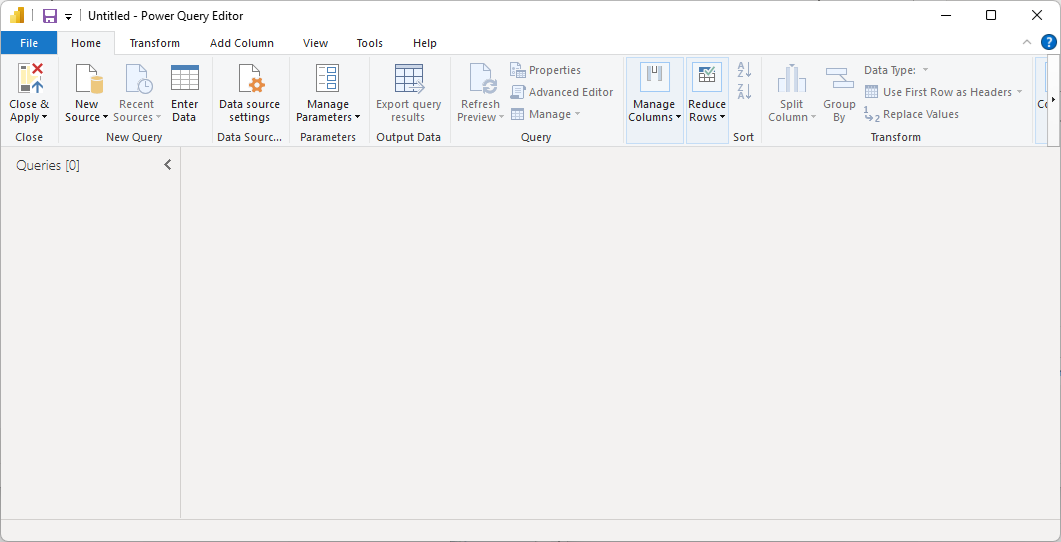
-
Right-click Query1 → Advanced Editor.
In the Queries pane, right-click the Query1 item. In the context menu, click Advanced Editor. This opens the M formula editor — a dark text box where you can type or paste raw M code.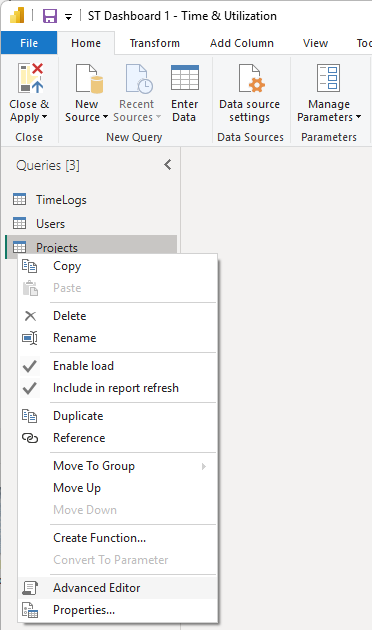
Step 4 — Run the Entity List Smoke-Test Query
The simplest possible smoke test is to call the OData service root — the base endpoint with no entity name appended. It returns a two-column table listing every available entity set by name. No data rows are loaded, it is instant, and it works even when the database is completely empty.
-
In the Advanced Editor, select all and delete.
Press Ctrl+A to select the placeholder text, then press Delete. -
Paste the service-root query below.
Copy the entire block, paste it into the Advanced Editor, then replaceYOUR_CID_HEREwith your actual CID andYOUR_API_KEY_HEREwith your API key. M — entity list smoke test (paste into Advanced Editor)let Source = OData.Feed( "https://stcloud67.com/odata/?cid=YOUR_CID_HERE", null, [Headers = [#"X-Api-Key" = "YOUR_API_KEY_HERE"]] ) in Source
-
Click Done.
Power BI evaluates the query and displays a preview. If the connection is successful you will see a two-column table — Name and Url — with one row for each of the 11 Standard Time® entity sets.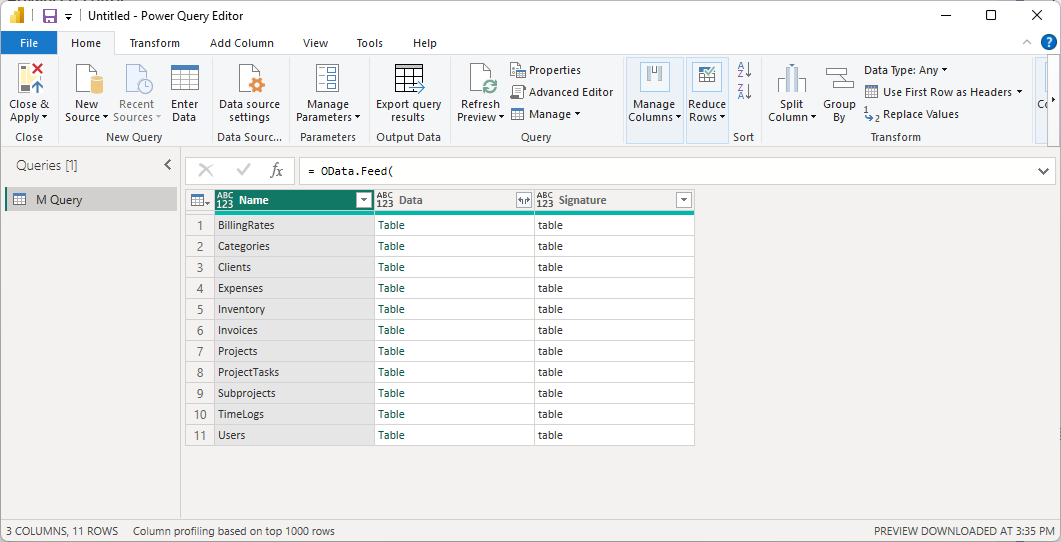

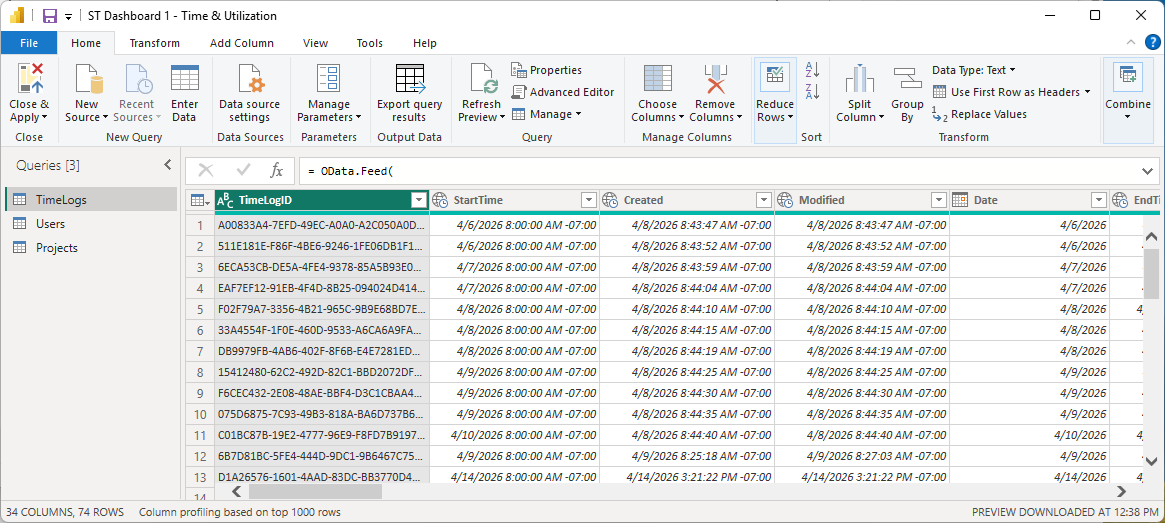
Step 5 — Run the TimeLogs Smoke-Test Query
Once Users works, confirm that your primary data table — TimeLogs — is also reachable. This is the table that drives most dashboards. Add a new Blank Query and run this in its Advanced Editor:
M — TimeLogs smoke test (paste into Advanced Editor)let Source = OData.Feed( "https://stcloud67.com/odata/TimeLogs?cid=YOUR_CID_HERE&$top=10", null, [Headers = [#"X-Api-Key" = "YOUR_API_KEY_HERE"]] ) in Source
For completeness, here is the Projects smoke test as well:
M — Projects smoke testlet Source = OData.Feed( "https://stcloud67.com/odata/Projects?cid=YOUR_CID_HERE&$top=10", null, [Headers = [#"X-Api-Key" = "YOUR_API_KEY_HERE"]] ) in Source
Step 6 — Verify the Result
After clicking Done in the Advanced Editor, Power BI runs the query and shows a preview. Here is what to look for:
| What you see | What it means |
|---|---|
| A table with column headers and rows of data | Connection confirmed. Your CID, API key, and network path are all correct. Click Close & Apply in the Power Query Editor to load the table into your report model. |
| A table with column headers but zero rows | Connection is working, but the entity is empty. This is normal for TimeLogs and Projects on a new installation. The Users query always returns at least one row for admin. |
| Error: DataSource.Error: 401 | API key is wrong, missing, or has been revoked. Re-copy the key from Standard Time® and verify there are no extra spaces. See Troubleshooting. |
| Error: DataSource.Error: 404 | The URL path is wrong — usually the wrong CID or a typo in the entity name. Double-check your CID and the exact URL path (e.g. /odata/Users). |
| Error: Expression.Error or Token expected | M syntax problem. Copy the query fresh from this page — a single missing quotation mark breaks the parser. |
| Could not connect / connection refused | Network issue: server unreachable. Check your internet connection, confirm the server is online, and verify your firewall allows outbound HTTPS to stcloud67.com. |
Troubleshooting
401 Unauthorized
Causes and fixes:
- API key not copied correctly — extra whitespace at the start or end is invisible and fatal. Re-copy directly from Standard Time®.
- API key revoked — someone clicked Revoke in the Standard Time® API Key dialog. Generate a new key.
- Key not pasted into the right part of the M query — verify it is between the inner quote marks after
#"X-Api-Key" =.
404 Not Found
Causes and fixes:
- Wrong CID — verify your CID from the URL you use to open Standard Time® (the value after
?cid=). CIDs are long alphanumeric strings, not short numbers. - Typo in the entity path — the URL must be exactly
/odata/Users,/odata/TimeLogs, etc. Capitalization matters. - Wrong server hostname — if you are on-premise, replace
stcloud67.comwith your own server address.
Power BI prompts for credentials
Fix: Click Anonymous or Web API (not Windows or Basic). Authentication is handled entirely by the
X-Api-Key header inside your M query — there is no separate Power BI credential to configure. If the dialog keeps appearing, delete the cached data source under File → Options → Data Source Settings and run the query again.
M syntax errors
Fix: Copy the query fresh from this page. Common causes: smart quotes substituted for straight quotes, an ampersand typed as
& instead of & (the HTML entity), or a line break inside a string literal. The entire query must use ASCII straight quotes only.
Connection works but data is stale
Next Steps — All OData Guides
Your connection is confirmed. Now you are ready to load all 11 entity sets, build relationships, write DAX measures, and publish production dashboards. Every guide below picks up where this smoke test leaves off.