What You Can Do with OData
Standard Time® exposes a live OData 4.0 REST feed that any modern BI tool can connect to directly. Instead of exporting a CSV and importing it into a dashboard tool, you point Power BI (or Excel, or Tableau) at the OData endpoint, and it reads fresh data every time you hit Refresh.

Eleven entity sets are available. Each maps to a separate Power BI table you can join to build rich cross-entity reports:
Time entries — who, what project, when, how long, billable status, and cost
Work orders / jobs — status, dates, client, rates, quoted cost, folder
Tasks — estimated vs. actual hours, cost, % complete, due date
Nested project phases with their own rates and quoted costs
Employees — name, workgroup, role, billing rates, hire date
Customers — contacts, addresses, tax rate, payment terms
Material usage, mileage, out-of-pocket costs per project
Parts catalog — qty in stock, costs, SKU, reorder triggers
Time log / expense categories with per-category billing rates
Invoice records — amounts, terms, paid status, balance due
Per-user, per-project, and per-category rate overrides
Install Power BI Desktop
Power BI Desktop is a free Windows app from Microsoft. The Microsoft Store version updates automatically and is the recommended path for most users.
-
Open the Microsoft Store.
Click the Start menu and search for Microsoft Store, then open it. Alternatively, press Win + S and type Microsoft Store. -
Search for Power BI Desktop.
In the Store search box, type Power BI Desktop and press Enter. Select the result published by Microsoft Corporation. -
Click Install.
The app is free to download. Installation takes a few minutes. Sign in with your Microsoft or work account when prompted — a free account is sufficient for building and viewing reports locally. -
Launch Power BI Desktop.
After installation, open Power BI Desktop from the Start menu. You will see a splash screen followed by a blank report canvas. You are ready to connect to the Standard Time® OData feed.
Generate Your API Key
Each call to the OData feed must include an API key in the request header. You generate this key once inside Standard Time® and then paste it into every Power BI query you create.
-
Open the Tools ribbon → Integration dropdown → OData API Key.
In the top ribbon, click the Tools tab. In the Integration panel, click the Integration dropdown and choose OData API Key.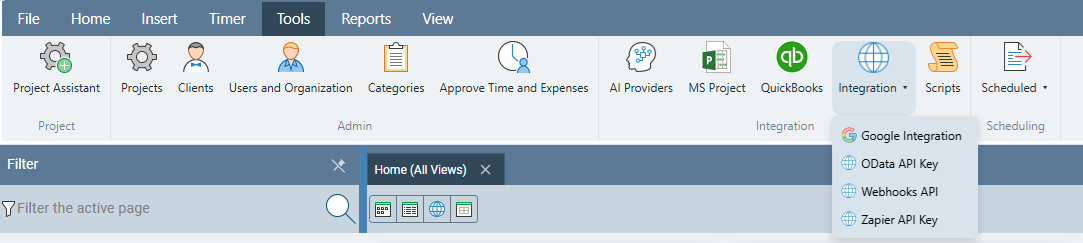
-
Generate or copy your key.
The API Key dialog shows your current key. If you have never generated a key before, click Generate. The key is a long alphanumeric string. Click anywhere on the key to select it, then copy it to your clipboard — you will paste it into each Power BI M query in the next section.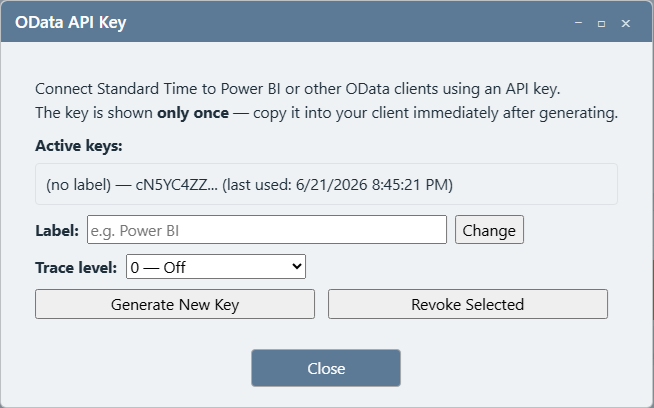
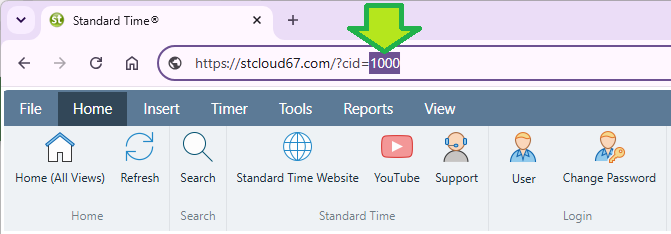
Your Customer ID (CID)
Every OData URL also requires your Customer ID (cid), which identifies your account on the server. Your CID is a long alphanumeric string unique to your Standard Time® subscription — it is not a short number. You can find it in the URL you use to open Standard Time® in your browser (the value after ?cid=), or by asking your Standard Time® administrator. In the query examples below, the placeholder cid=1000 is used — replace it with your actual CID before connecting.
Connect Power BI — Step by Step
Each Standard Time® entity (TimeLogs, Projects, etc.) becomes its own table in Power BI. You add tables one at a time by creating a separate query for each. Here is the complete workflow for adding your first table.
-
Open Power BI Desktop.
After the splash screen closes you will see a blank report canvas — no tables, no visuals yet.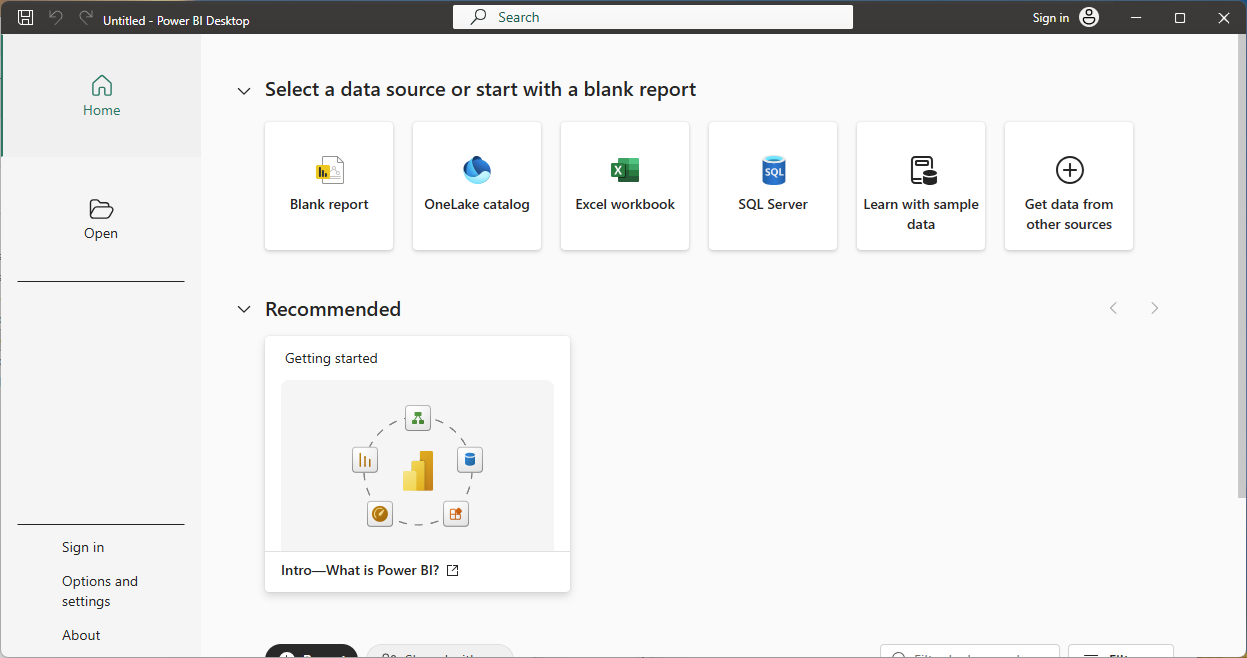
-
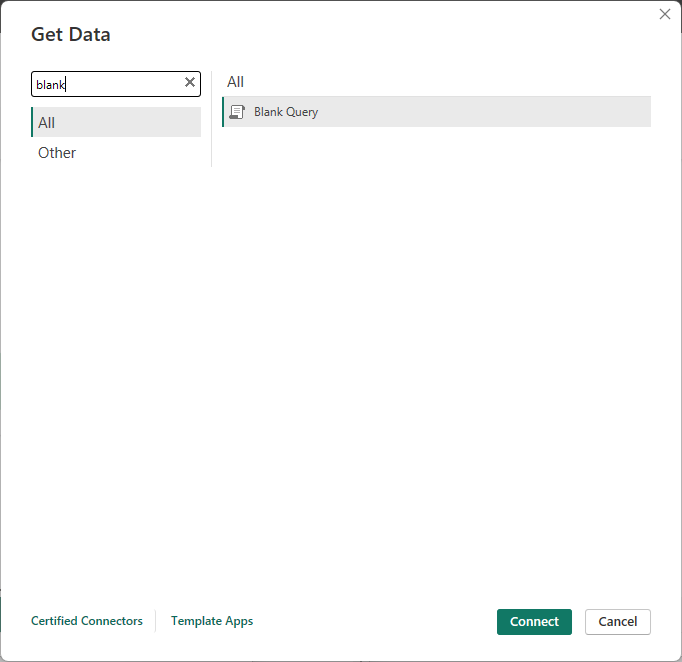
On the Home ribbon, click Get Data → Blank Query.
Open the Home tab in the ribbon. Click the Get Data dropdown arrow, then choose More… from the bottom of the list, or look for the Blank Query option directly under New Source.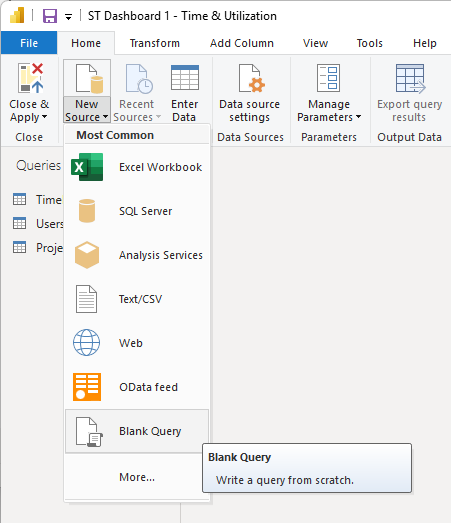
-
The Power Query Editor opens with an empty query.
A new window (the Power Query Editor) opens. You will see a query named Query1 in the left-hand Queries pane. The main area shows no data yet.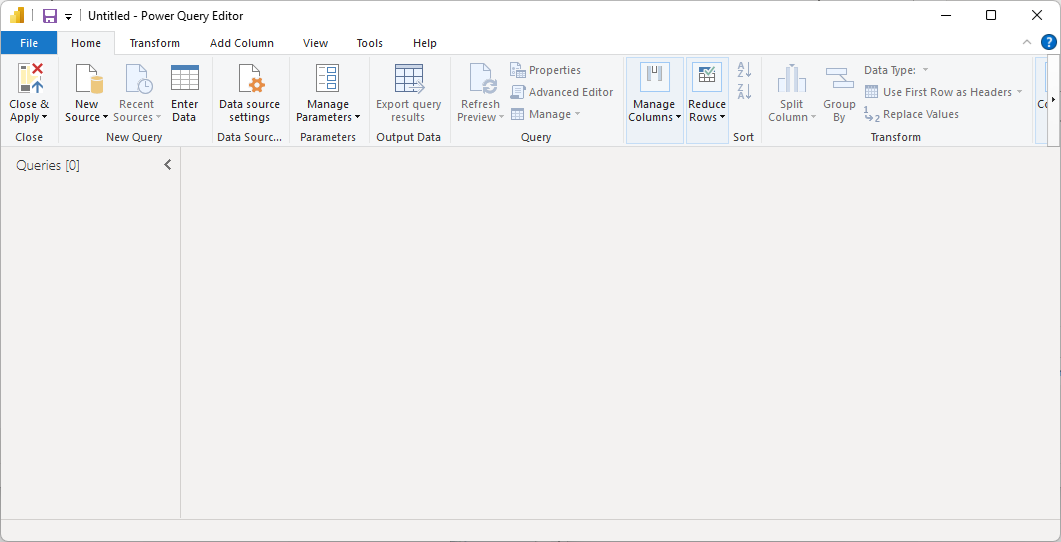
-
Right-click the query name → Advanced Editor.
In the Queries pane on the left, right-click Query1. In the context menu that appears, select Advanced Editor. This opens the M formula editor where you will paste your query.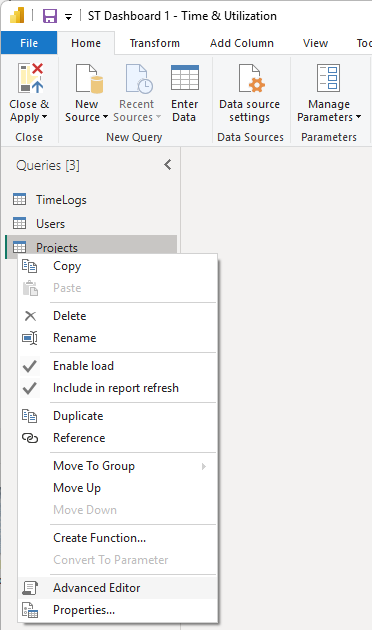
-
Select all, then paste the M query for the entity you want.
In the Advanced Editor, press Ctrl+A to select the existing placeholder text, then paste the M query from the Query Reference section below. ReplaceYOUR_API_KEYwith the key you copied earlier and1000with your actual CID.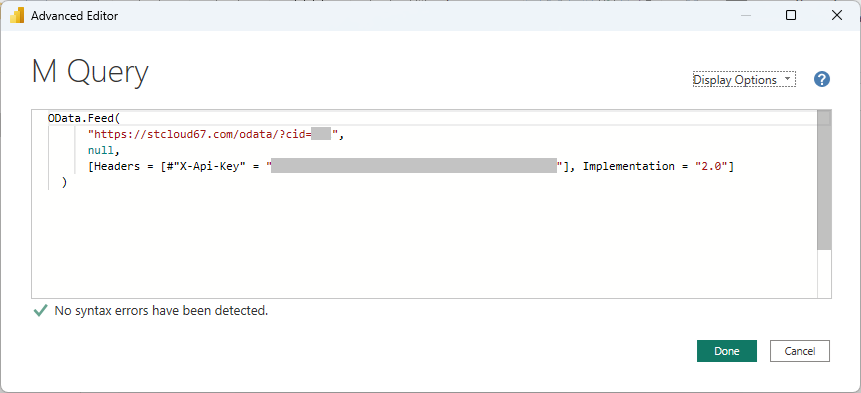
-
Click Done — Power BI fetches a data preview.
After clicking Done, Power BI executes the query and shows a preview of the returned rows in the main editor area. If you see column headers and rows of data, the connection is working.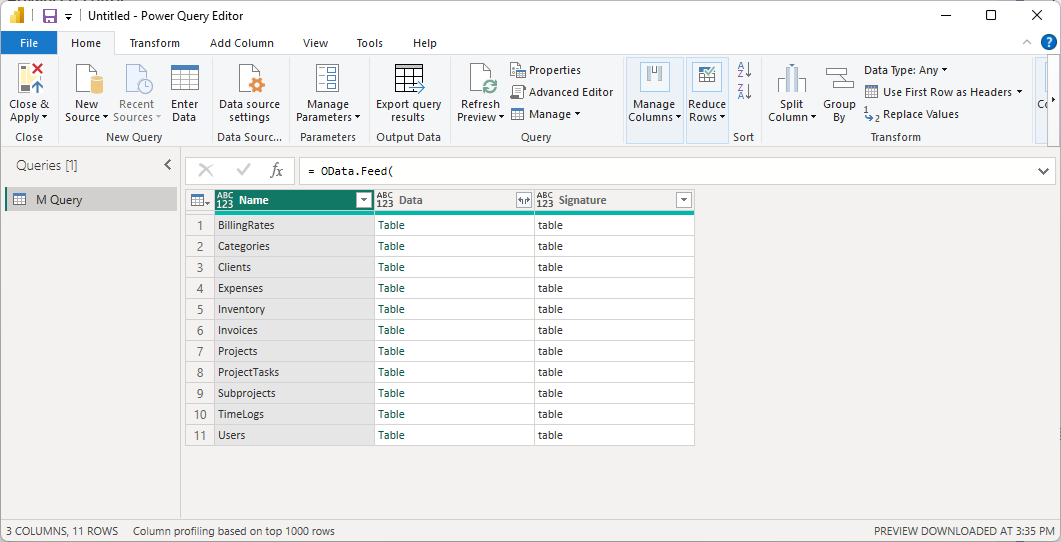
-
Rename the query, then Close & Apply.
Double-click the query name in the left pane and rename it to match the entity — for example, TimeLogs. Repeat steps 2–7 for each additional entity set you need. When all queries are added, click Close & Apply on the Home ribbon to load the data into the Power BI data model.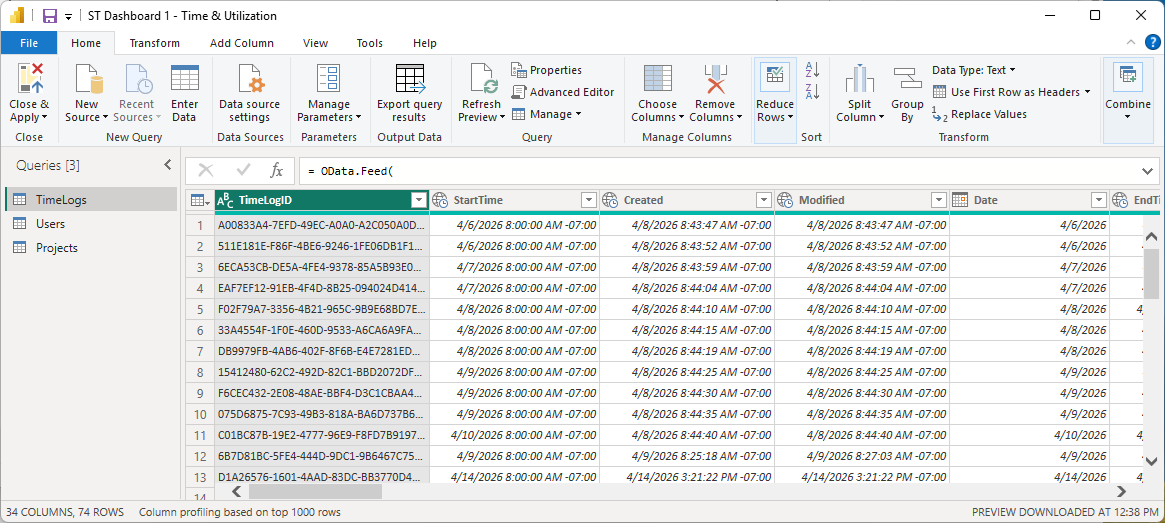
OData Query Reference
Each query below is a complete, paste-ready Power BI M query. Before using them:
- Replace
YOUR_API_KEYwith the key you copied from Standard Time®. - Replace
1000incid=1000with your actual Customer ID. CIDs are normally long alphanumeric strings — 1000 is a placeholder used in these examples only.


Supported OData Query Parameters
| Parameter | Example | Description |
|---|---|---|
$filter | $filter=Created gt 2026-01-01T00:00:00-07:00 | Filter rows server-side before returning results. Supported operators: eq ne gt ge lt le and or not |
$select | $select=TimeLogID,Date,TimeLogDurationHours | Return only the named columns — faster load for wide entities |
$orderby | $orderby=Date desc | Sort the result set by one or more columns |
$top | $top=500 | Limit the number of rows returned (default: 1,000) |
$skip | $skip=1000 | Skip N rows — combine with $top for pagination |
$count | $count=true | Include the total row count in the response metadata |
TimeLogs
The core labor data table. Each row is one time entry — who worked, on what project and task, start/end times, duration in hours, billable flag, and computed cost columns. Large datasets; use the DaysBack variable to limit the date range.
let
    // Fetch time logs created in the last N days.
    // Set DaysBack = 9999 to load all records (slower on large accounts).
    DaysBack = 14,

    // Build an ISO 8601 DateTimeOffset string that includes your local UTC offset,
    // e.g. "2026-06-07T00:00:00-07:00". The OData feed compares this against Created.
    Cutoff = DateTimeZone.ToText(
        DateTimeZone.LocalNow() - #duration(DaysBack, 0, 0, 0),
        "yyyy-MM-ddTHH:mm:sszzz"
    ),

    Source = OData.Feed(
        "https://stcloud67.com/odata/TimeLogs?cid=1000&$filter=Created gt " & Cutoff,
        null,
        [Headers = [#"X-Api-Key" = "YOUR_API_KEY"]]
    )
in
    Source
Projects
Work orders and jobs — status, priority, start/finish dates, billing type, quoted cost, and folder. Join to TimeLogs on ProjectID to group hours by job.
let
    DaysBack = 30,

    Cutoff = DateTimeZone.ToText(
        DateTimeZone.LocalNow() - #duration(DaysBack, 0, 0, 0),
        "yyyy-MM-ddTHH:mm:sszzz"
    ),

    Source = OData.Feed(
        "https://stcloud67.com/odata/Projects?cid=1000&$filter=Created gt " & Cutoff,
        null,
        [Headers = [#"X-Api-Key" = "YOUR_API_KEY"]]
    )
in
    Source
ProjectTasks
Task-level data: estimated duration, actual hours logged, remaining hours, cost estimates vs. actuals, percent complete, and due dates. Join to Projects on ProjectID and to TimeLogs on ProjectTaskID.
let
    DaysBack = 30,

    Cutoff = DateTimeZone.ToText(
        DateTimeZone.LocalNow() - #duration(DaysBack, 0, 0, 0),
        "yyyy-MM-ddTHH:mm:sszzz"
    ),

    Source = OData.Feed(
        "https://stcloud67.com/odata/ProjectTasks?cid=1000&$filter=Created gt " & Cutoff,
        null,
        [Headers = [#"X-Api-Key" = "YOUR_API_KEY"]]
    )
in
    Source
Subprojects
Nested project phases and subassemblies. Small table — no date filter needed. Join to Projects on ProjectID.
let
    Source = OData.Feed(
        "https://stcloud67.com/odata/Subprojects?cid=1000",
        null,
        [Headers = [#"X-Api-Key" = "YOUR_API_KEY"]]
    )
in
    Source
Users
Employee roster — full name, email, workgroup, department, role, billing rates, and hire date. Join to TimeLogs on UserID to get employee names on time log rows.
let
    Source = OData.Feed(
        "https://stcloud67.com/odata/Users?cid=1000",
        null,
        [Headers = [#"X-Api-Key" = "YOUR_API_KEY"]]
    )
in
    Source
Clients
Customer records — company name, main and billing contacts, addresses, tax rate, and payment terms. Join to Projects on ClientID for customer-level job reports.
let
    Source = OData.Feed(
        "https://stcloud67.com/odata/Clients?cid=1000",
        null,
        [Headers = [#"X-Api-Key" = "YOUR_API_KEY"]]
    )
in
    Source
Expenses
Material usage, out-of-pocket costs, and mileage records. Created automatically when inventory barcodes are scanned. Combine with TimeLogs for full job cost (labor + materials). Larger tables benefit from a date filter.
let
    DaysBack = 90,

    Cutoff = DateTimeZone.ToText(
        DateTimeZone.LocalNow() - #duration(DaysBack, 0, 0, 0),
        "yyyy-MM-ddTHH:mm:sszzz"
    ),

    Source = OData.Feed(
        "https://stcloud67.com/odata/Expenses?cid=1000&$filter=Created gt " & Cutoff,
        null,
        [Headers = [#"X-Api-Key" = "YOUR_API_KEY"]]
    )
in
    Source
Inventory
Parts catalog — names, SKUs, current stock quantities, unit costs, reorder rules, vendor names. Useful for dashboards tracking stock levels and cost-of-goods data alongside labor.
let
    Source = OData.Feed(
        "https://stcloud67.com/odata/Inventory?cid=1000",
        null,
        [Headers = [#"X-Api-Key" = "YOUR_API_KEY"]]
    )
in
    Source
Categories
Time log and expense categories (e.g., Machining, Assembly, Inspection). Each has optional client and salary rate overrides. Join to TimeLogs on CategoryID.
let
    Source = OData.Feed(
        "https://stcloud67.com/odata/Categories?cid=1000",
        null,
        [Headers = [#"X-Api-Key" = "YOUR_API_KEY"]]
    )
in
    Source
Invoices
Invoice records — date sent, due date, subtotal, tax, total amount, amount paid, balance due, and paid-in-full flag. Join to Clients on ClientID for receivables dashboards.
let
    Source = OData.Feed(
        "https://stcloud67.com/odata/Invoices?cid=1000",
        null,
        [Headers = [#"X-Api-Key" = "YOUR_API_KEY"]]
    )
in
    Source
BillingRates
Per-user, per-project, and per-category billing rate overrides with effective date ranges. Useful for auditing rate changes and building blended-rate calculations in DAX.
let
    Source = OData.Feed(
        "https://stcloud67.com/odata/BillingRates?cid=1000",
        null,
        [Headers = [#"X-Api-Key" = "YOUR_API_KEY"]]
    )
in
    Source
Define Table Relationships
After loading your tables, switch to the Model view (the icon that looks like three connected boxes on the left rail) to define how the tables join. Power BI sometimes auto-detects relationships based on column names — review and correct any it creates automatically.
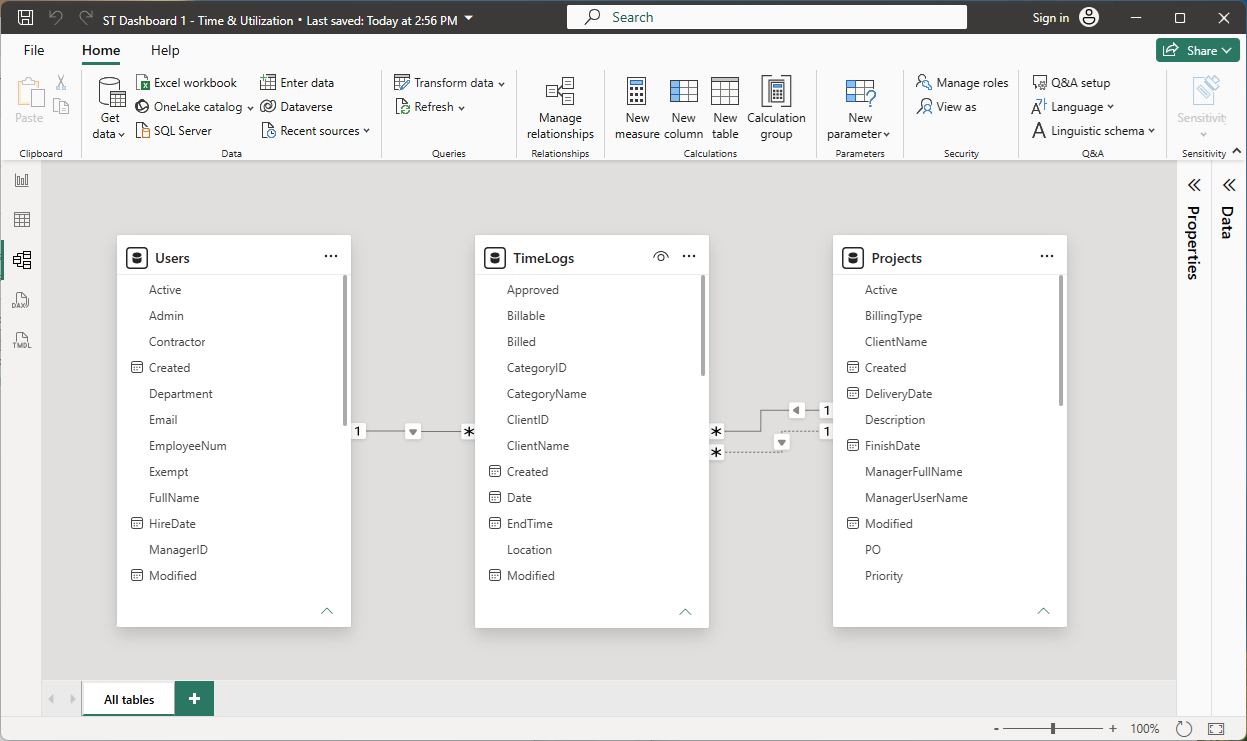
To create or edit a relationship, drag a column from one table onto the matching column in another, or double-click an existing relationship line to open the Edit Relationship dialog.
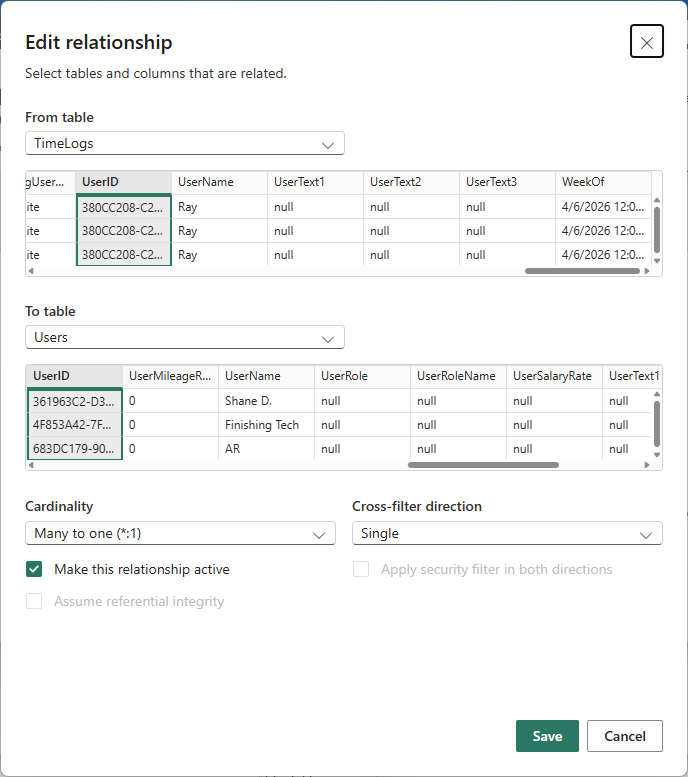
Recommended Relationships
| From table (many side) | Column | To table (one side) | Column |
|---|---|---|---|
| TimeLogs | UserID | Users | UserID |
| TimeLogs | ProjectID | Projects | ProjectID |
| TimeLogs | ClientID | Clients | ClientID |
| TimeLogs | ProjectTaskID | ProjectTasks | TaskID |
| TimeLogs | CategoryID | Categories | CategoryID |
| TimeLogs | SubsystemID | Subprojects | SubsystemID |
| Expenses | UserID | Users | UserID |
| Expenses | ProjectID | Projects | ProjectID |
| Expenses | ClientID | Clients | ClientID |
| Projects | ClientID | Clients | ClientID |
| ProjectTasks | ProjectID | Projects | ProjectID |
| Invoices | ClientID | Clients | ClientID |
| Invoices | ProjectID | Projects | ProjectID |
| BillingRates | UserID | Users | UserID |
| BillingRates | ProjectID | Projects | ProjectID |
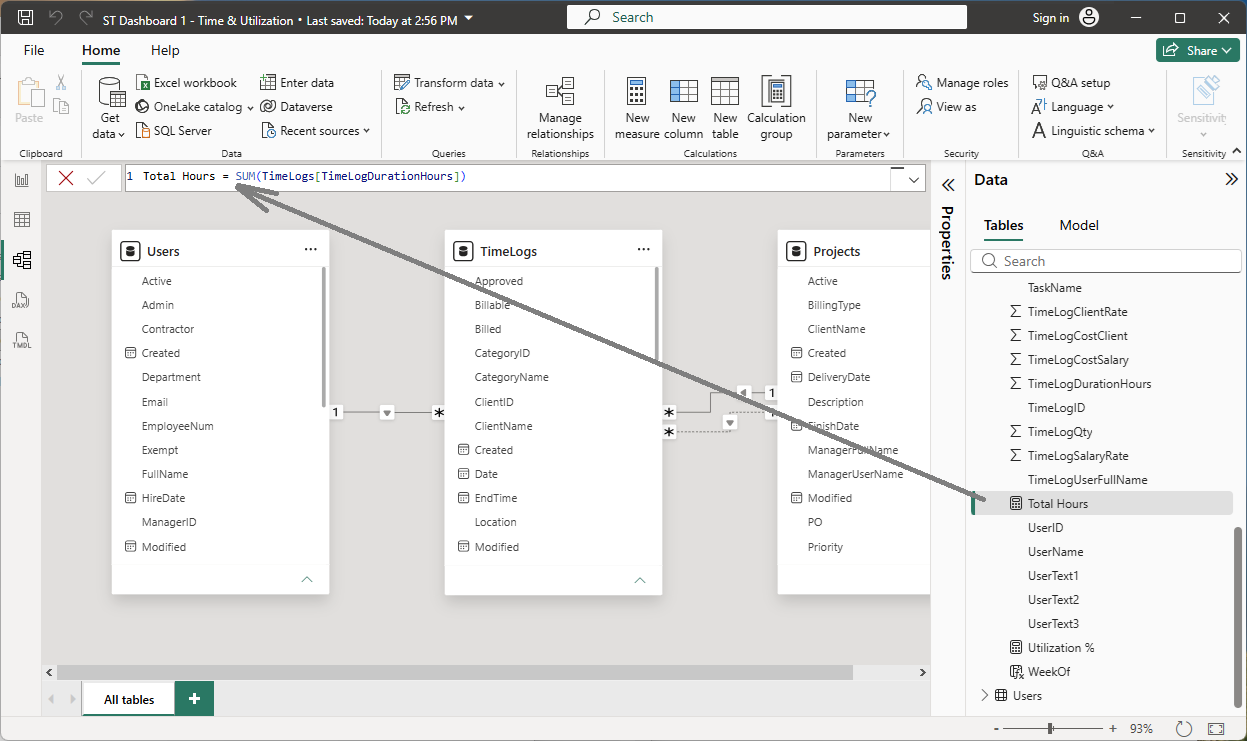
Build DAX Measures
After defining relationships, add calculated measures to the TimeLogs or Expenses table for use in charts and cards. To add a measure, right-click the target table in the Fields pane → New measure, then type the DAX formula.
Starter DAX Measures
Total Hours — sum of all logged hours across the current filter context:
Total Hours = SUM(TimeLogs[TimeLogDurationHours])
Billable Hours — hours where the Billable flag is true:
Billable Hours = CALCULATE(SUM(TimeLogs[TimeLogDurationHours]), TimeLogs[Billable] = TRUE())
Total Labor Cost — sum of the computed client-side cost field:
Total Labor Cost = SUM(TimeLogs[TimeLogCostClient])
Total Material Cost — sum of expense amounts:
Total Material Cost = SUM(Expenses[ExpenseAmount])
Total Job Cost — labor plus materials combined:
Total Job Cost = [Total Labor Cost] + [Total Material Cost]
Utilization % — billable hours as a percentage of total hours (useful for resource dashboards):
Utilization % = DIVIDE([Billable Hours], [Total Hours], 0)
Hours Last 7 Days — rolling window measure for trend sparklines:
Hours Last 7 Days =
CALCULATE(
    [Total Hours],
    DATESINPERIOD(TimeLogs[Date], TODAY(), -7, DAY)
)
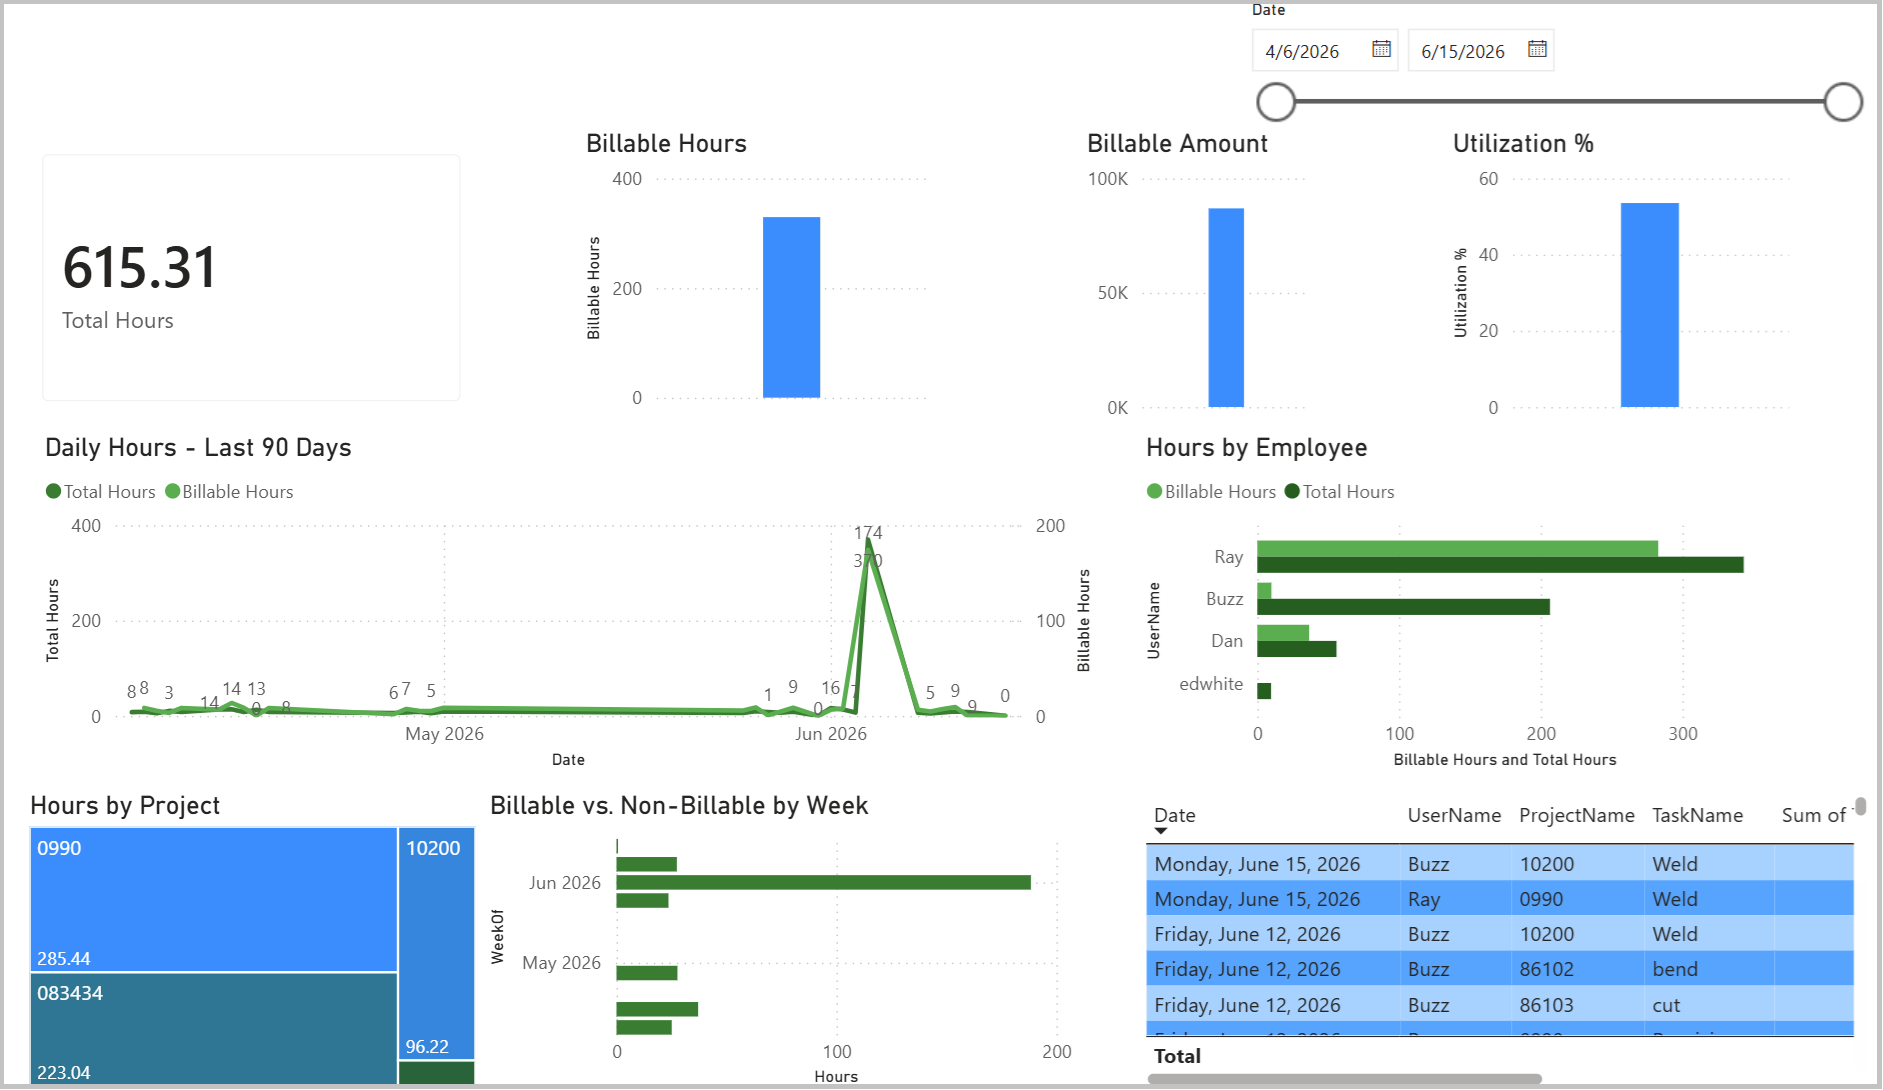
Sample Reports & Dashboards
Once your tables, relationships, and measures are set up, you can build any report by dragging fields from the Fields pane onto the canvas and switching visual types in the Visualizations pane.
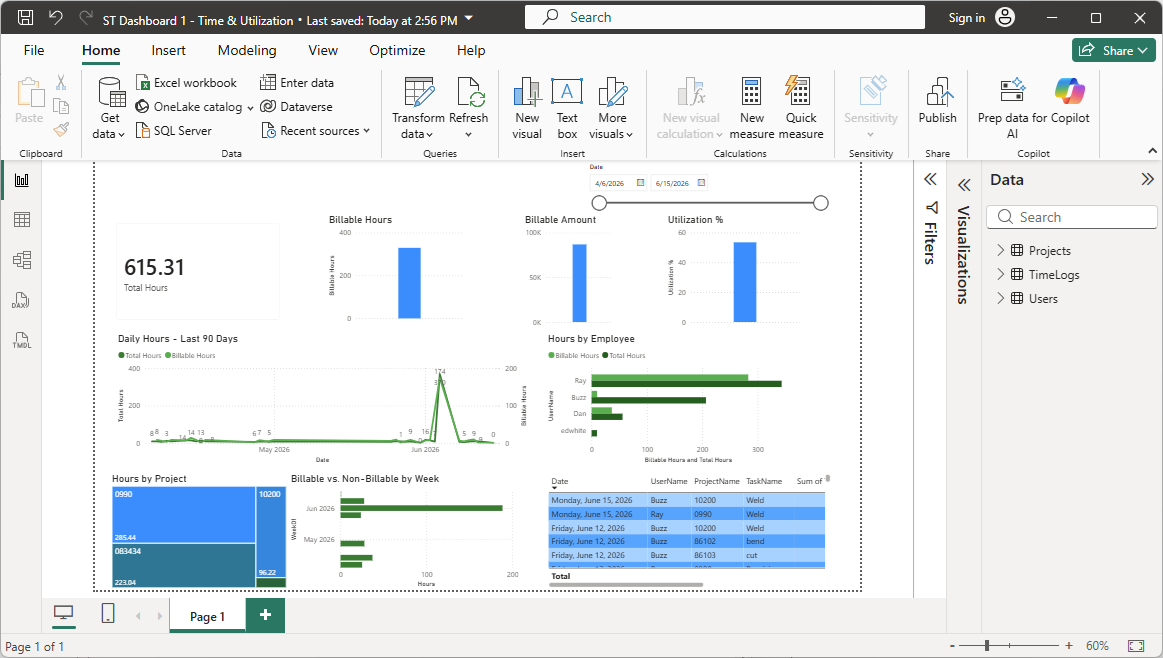
Common starter visuals for Standard Time® data:
- Bar chart — Hours by Project: drag ProjectName to Axis, Total Hours to Values
- Line chart — Daily hours trend: drag TimeLogs[Date] to Axis (set to Day), Total Hours to Values
- Donut chart — Billable vs. Non-billable: drag TimeLogs[Billable] to Legend, Total Hours to Values
- Matrix — Hours by Employee and Week: drag Users[FullName] to Rows, TimeLogs[Date] (Week) to Columns, Total Hours to Values
- KPI cards: drop Total Hours, Billable Hours, Total Labor Cost, and Utilization % onto card visuals
- Table — Job cost summary: drag ProjectName, Total Hours, Total Labor Cost, Total Material Cost, Total Job Cost
Beyond Power BI
The Standard Time® OData feed is a standard HTTP REST API. Any application that can send an authenticated GET request can consume it — Power BI is just the most common starting point. The same API key, CID, and URL patterns work identically in:
Use Data → Get Data → From OData Feed. Paste the entity URL and add the X-Api-Key header in the connection settings. Results land in a Power Query table you can refresh on demand.
Connect via Connect → To a Server → OData. Enter the endpoint URL, set the authentication header, and choose the entity sets to pull. Tableau handles pagination automatically.
Use the Infinity data source plugin with type set to JSON and the OData URL as the endpoint. Add X-Api-Key as a custom header. Good for real-time shop floor dashboards on wall-mounted displays.
Use an HTTP action with the OData URL, GET method, and X-Api-Key header. Parse the returned JSON with Parse JSON and feed the results into downstream steps — Teams notifications, SharePoint lists, or email summaries.
A simple requests.get(url, headers={"X-Api-Key": key}) call returns JSON. Parse response.json()["value"] directly into a pandas DataFrame for custom analysis, ML pipelines, or ETL jobs.
Use httr::GET(url, httr::add_headers("X-Api-Key" = key)) and parse the response with jsonlite::fromJSON. The odata CRAN package also provides a native OData client for R.
Add an OData linked service pointing to the Standard Time® endpoint. ADF handles pagination natively and can load data into Azure SQL, Data Lake, or Synapse Analytics on a schedule.
Use Postman or curl to explore the API, test filters, and prototype queries before building full integrations. Add the X-Api-Key header and call any entity URL to inspect the raw JSON response.
Smoke-Test Your Power BI OData Connection — not connected yet? Start here: install Power BI, get your CID and API key, and confirm a live connection with one paste-ready M query before you build anything.
Build Four Dashboards in Power BI — step-by-step recipes for shop floor time, project budget, full job cost, and inventory health dashboards using these same OData queries.
OData Schema Reference — every entity set, every column name, OData type, and FK relationship in one place.
Zapier Integration — need event-driven automation instead of dashboards? Trigger Zaps off record changes and connect to 7,000+ apps.
Webhooks Integration — need a real-time push notification the instant a record changes, without a BI tool or Zapier account? Register your own HTTPS endpoint instead.
Google Sheets Integration — QuickBooks Online Integration — All Integrations