Administration  ·  Reporting

How to Run Time Reports

The Time Logs page in Standard Time® is your central reporting view — every timer punch, manual entry, and barcode scan lands here. This guide walks you through opening Time Logs, clearing out stale filters, setting up the three-panel view that admins rely on, narrowing results to the date range you need, and exporting to Excel or Google Sheets.

Five-step workflow: 1 Home › Time Logs, 2 Clear old filters, 3 Three panel view, 4 Date range filter, 5 File › Export
The full reporting workflow — from opening Time Logs through to exporting your results.

Opening Time Logs

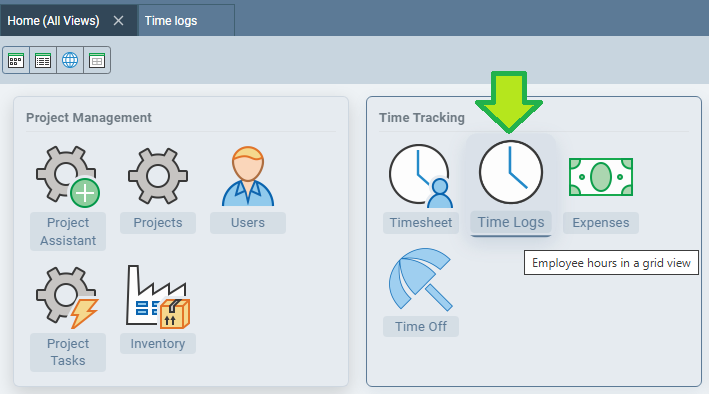
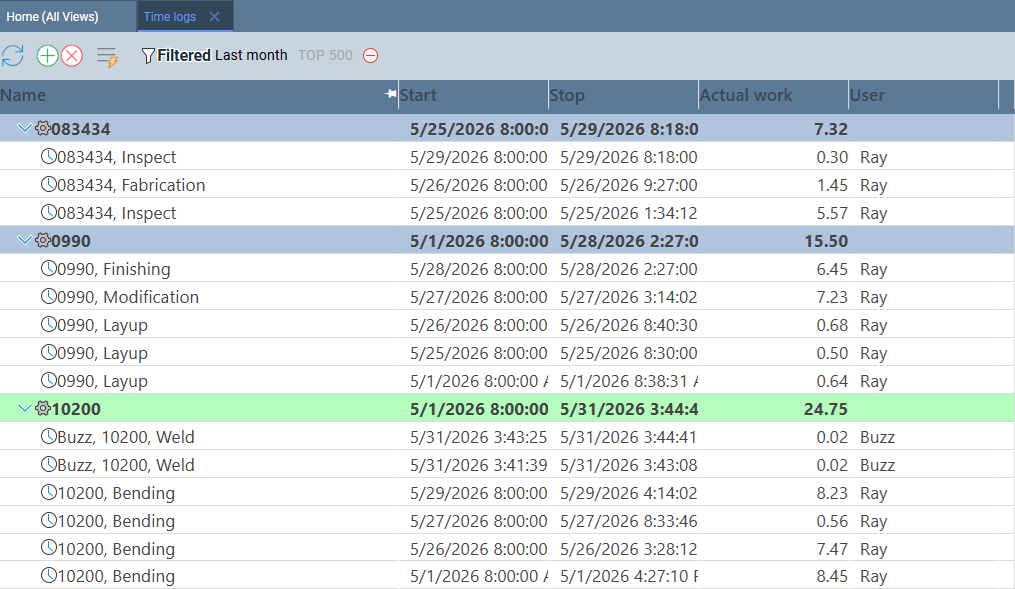
All recorded time lives in one place. From the Standard Time® Home screen, click Time Logs. The page opens showing every time entry in the system — unfiltered by default, so you will see entries from all users and all projects until you apply filters.

Navigation path:
  1. Open Standard Time®.
  2. From the Home screen, click Time Logs.
  3. The Time Logs grid opens with all recorded entries.
Standard Time® Home screen with the Time Logs tile highlighted
Tip: If you do not see a Time Logs icon on the Home screen, your account may have that right disabled. Ask your Standard Time® administrator to enable Access to Time Logs in your User Rights popup.

Clearing Old Filters

Standard Time® remembers your last filter settings between sessions. Before building a new report, it is good practice to remove any leftover filters so you are starting from a clean slate. Active filters appear as chips or rows in the Filter panel; each one has a red button on the right side. Click it to remove that filter.

Filter panel showing two stale filter chips — Date: Last Quarter and User: J. Smith — each with a red minus button. After clicking the minus buttons the panel is empty and ready for a new report.
Stale filters from a previous session appear as chips in the Filter panel. Click each red button to remove them before applying a new date range.
Filter panel close-up showing the red minus button used to remove an active filter
To remove an active filter:
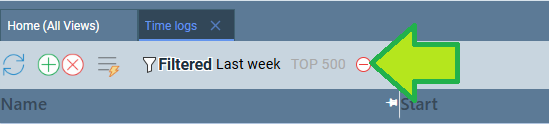
  1. Open the page you want to display.
  2. Look for the red button in the toolbar at the top of that page.
  3. Click the red button on the right side of that filter.
Tip: It is a common mistake to run a report and get unexpectedly narrow results because an old user or project filter was still active. If your totals look too low, check the Filter panel first.

The Three Panel View

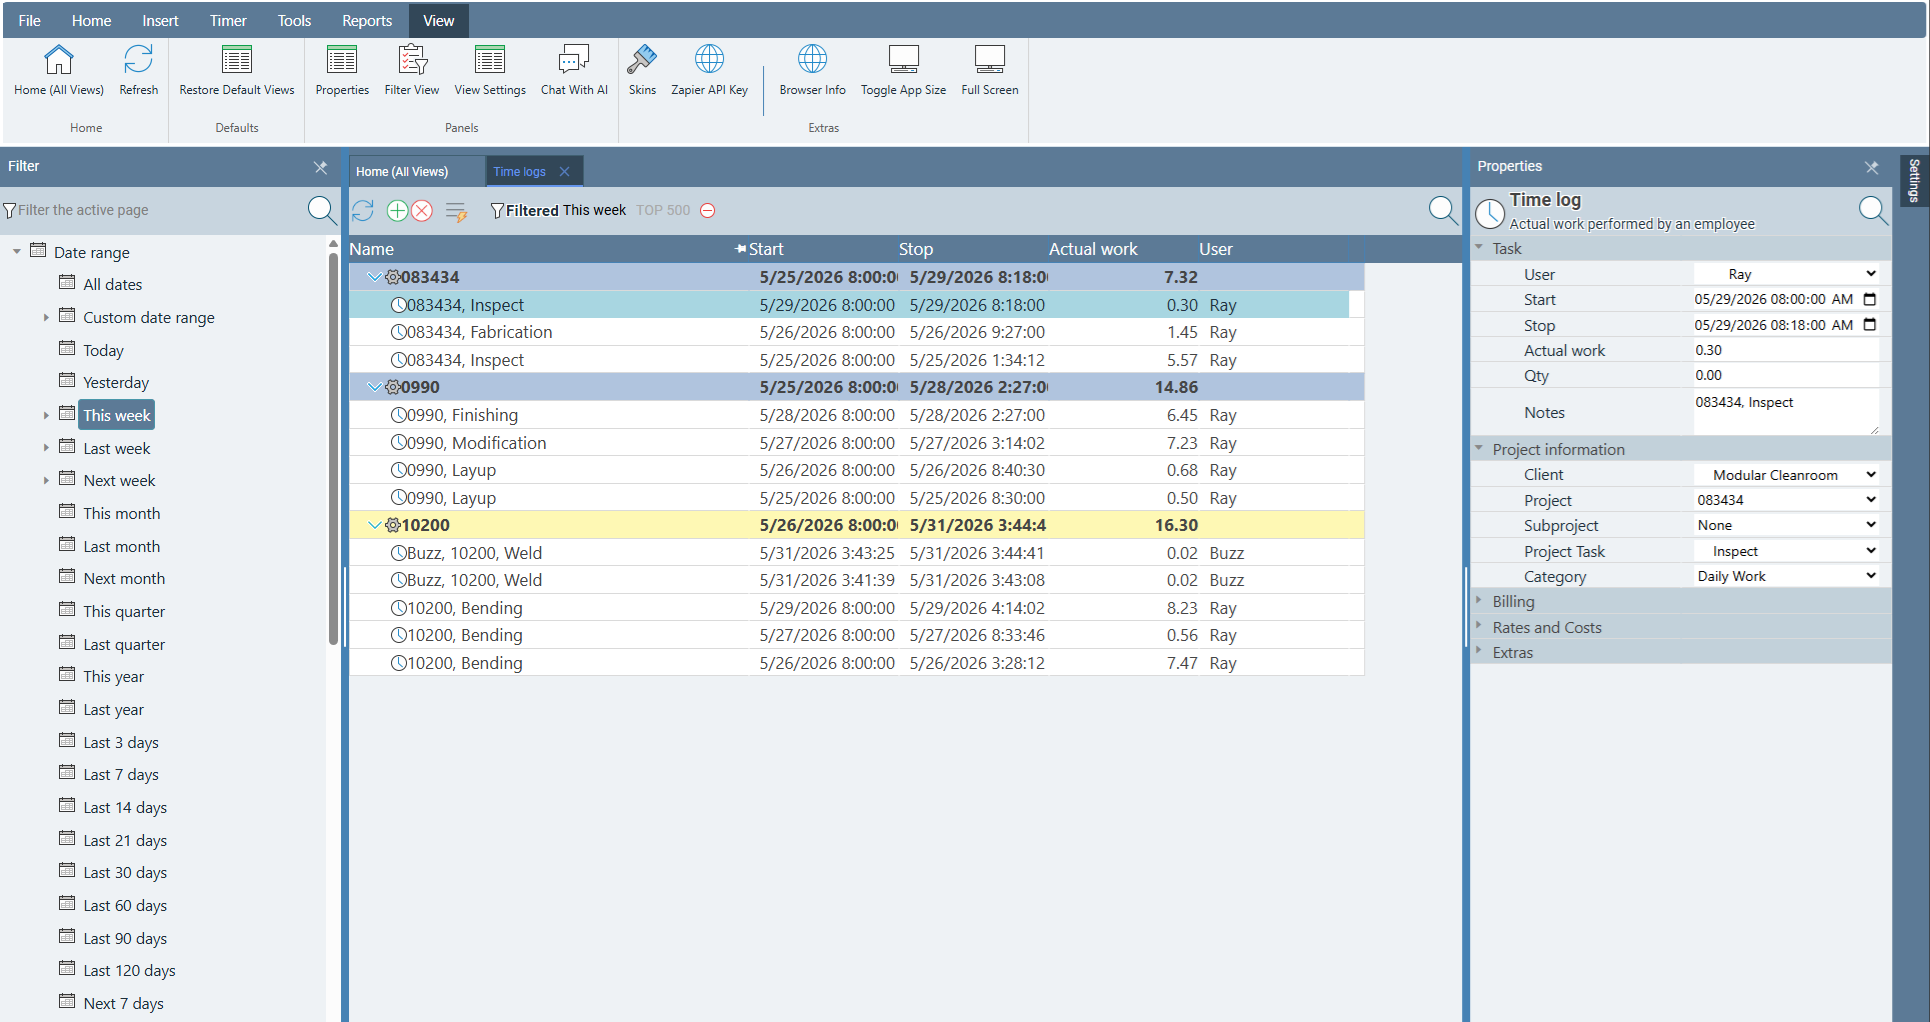
The Time Logs page supports a three-panel layout that puts filtering controls, the time entry grid, and the properties editor all on screen at once. This is the view most administrators use when reviewing or editing time. Enable both panels from the View menu.

Time Logs page in three-panel layout: Filter panel on the left for date range and user filters, time entry grid in the center, Properties panel on the right for editing the selected row
The three-panel layout — Filter panel on the left, time log grid in the center, Properties panel on the right. All three visible simultaneously makes reviewing and correcting entries fast.
To enable the three-panel view:
  1. With the Time Logs page open, click View in the menu bar.
  2. Click Filter to show the Filter panel on the left side.
  3. Click View > Properties to show the Properties panel on the right side.
  4. The grid now sits between both panels — resize any panel by dragging its border.
Standard Time® Time Logs page showing the three-panel view with Filter panel on the left, time log grid in the center, and Properties panel on the right
Tip: Standard Time® remembers which panels are open between sessions. Once you enable the three-panel view, it will be there the next time you open Time Logs — you only need to set it up once.

Filtering by Date Range

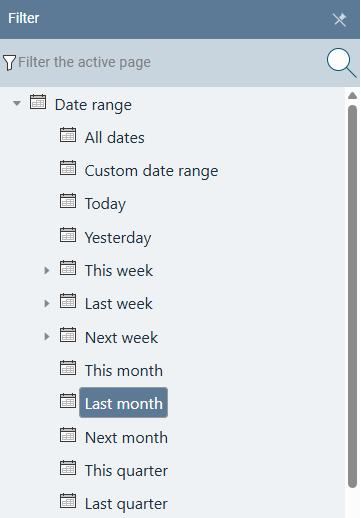
The most common filter for any time report is a date range — limiting the results to a specific pay period, month, quarter, or custom window. In the Filter panel, open the Date Range section and choose a preset or enter custom dates.

To apply a date range filter:
  1. Make sure the Filter panel is visible (see Three Panel View above).
  2. In the Filter panel, find the Date Range section and click to expand it.
  3. Choose a preset — such as Last Month, This Week, Last Quarter, or This Year — or enter a custom start and end date.
  4. The time log grid updates immediately to show only entries within that range.
Filter panel with the Date Range section expanded and Last Month selected as the active filter

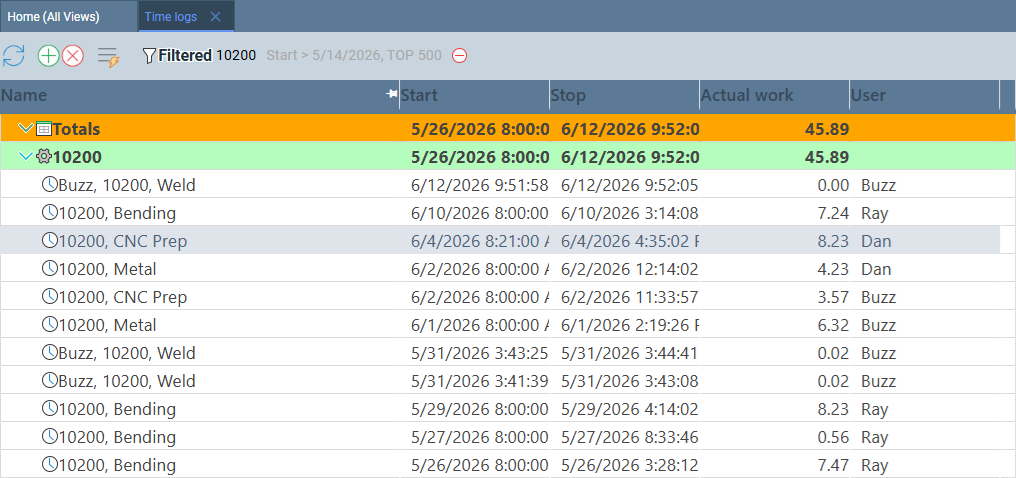
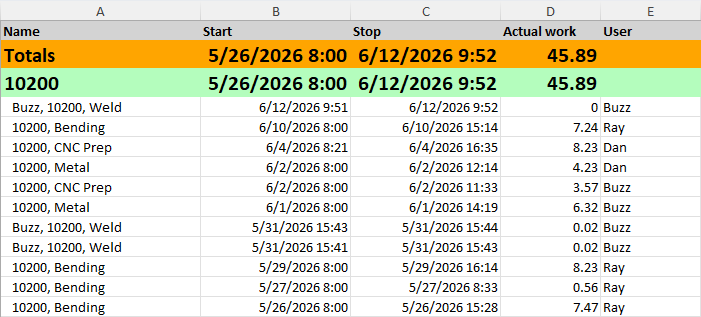
Once the date range is applied, the grid shows only the matching entries. You can further narrow results by adding a user filter, a project filter, or both — each additional filter stacks on top of the date range.

Time Logs grid showing entries filtered to last month — rows of time entries with date, user, project, and hours columns

The totals row at the top of the grid sums hours for the current filtered view. This is the number to use for payroll review, job costing, or billing — it automatically reflects whatever filters are active.

Time Logs grid with the totals row visible at the top, showing total hours for the filtered date range
Tip — filtering by user or project: After setting the date range, you can add more filters in the same panel. Choose a workgroup or individual employee in the User section, or select a project or folder in the Project section. The grid and totals update with each filter you add.

Adding Columns to Export

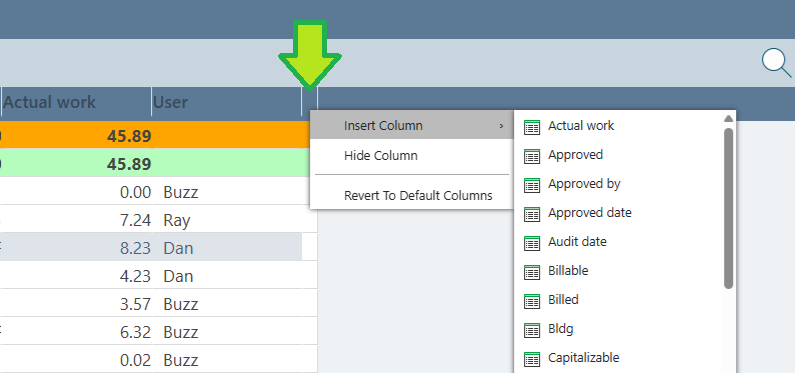
Before exporting, you can add extra columns to the Time Logs grid so they appear in your spreadsheet. Right-click any column header and choose Insert > Column to insert a new column at that position. A column picker lets you choose which field to display — project, task, user, notes, billing rate, and more.

To add a column to the grid:
  1. Right-click any column header in the Time Logs grid.
  2. Choose Insert > Column from the context menu.
  3. Select the field you want to add from the column picker.
  4. The new column appears in the grid and will be included in the next export.
Right-click context menu on the last column header in the Time Logs grid, showing Insert › Column selected to add a new column at the end
Adding a column at the end: Right-click on the blank space at the very end of the column header row — past the last visible column — to insert a new column at the far right of the grid. This is the fastest way to append a field without shifting any existing columns. The screenshot above shows exactly this: right-clicking in the empty header area to add a column to the end.
Tip: Column layout is saved between sessions, so set up your preferred columns once and they will be there every time you open Time Logs. Remove a column by right-clicking its header and choosing Delete > Column.

Exporting Results

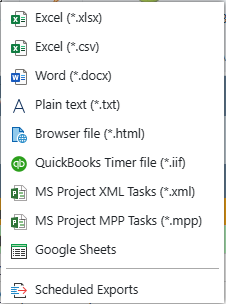
Once the grid shows the entries you need, export them to a spreadsheet with File > Export. Standard Time® can send the results directly to Microsoft Excel or to a live Google Sheet — both include the same columns: date, duration, actual work, project, user, task, and notes.

File › Export in Standard Time® leads to two destinations: Microsoft Excel (.xlsx download) and Google Sheets (live spreadsheet). Both output the same columns: Date, Duration, Actual Work, Project, User, and Notes.
File › Export sends the current filtered grid to Excel or Google Sheets. The same data lands in both — choose based on where you plan to work with it.
To export the time log grid:
  1. Apply your filters (date range, user, project) so the grid shows exactly what you want to export.
  2. Click File in the menu bar, then choose Export.
  3. Select your destination — Excel or Google Sheets.
  4. Standard Time® exports the currently visible (filtered) rows only — not the full unfiltered data set.
File menu open in Standard Time® with the Export option highlighted, showing format choices

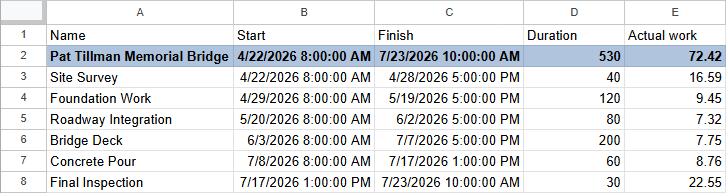
The exported file includes one row per time log entry, with separate columns for date, duration, and actual work. Pivot the data in Excel or use Google Sheets formulas to group by employee, project, or week.

Excel spreadsheet showing exported time log data with columns for date, duration, and actual work Google Sheets spreadsheet showing exported time log data with the same date, duration, and actual work columns
Tip — automating recurring exports: If you need the same report on a weekly or monthly schedule, Standard Time® supports Scheduled Exports that run automatically and can send results to a file, email attachment, or Google Sheet. See Advanced: Scheduled Exports for the full property reference.
Google Sheets integration: Exporting to Google Sheets requires a configured connection — Service Account for automated exports, or OAuth2 for per-user access. See Google Sheets Import and Export for setup instructions.

Legacy Reports

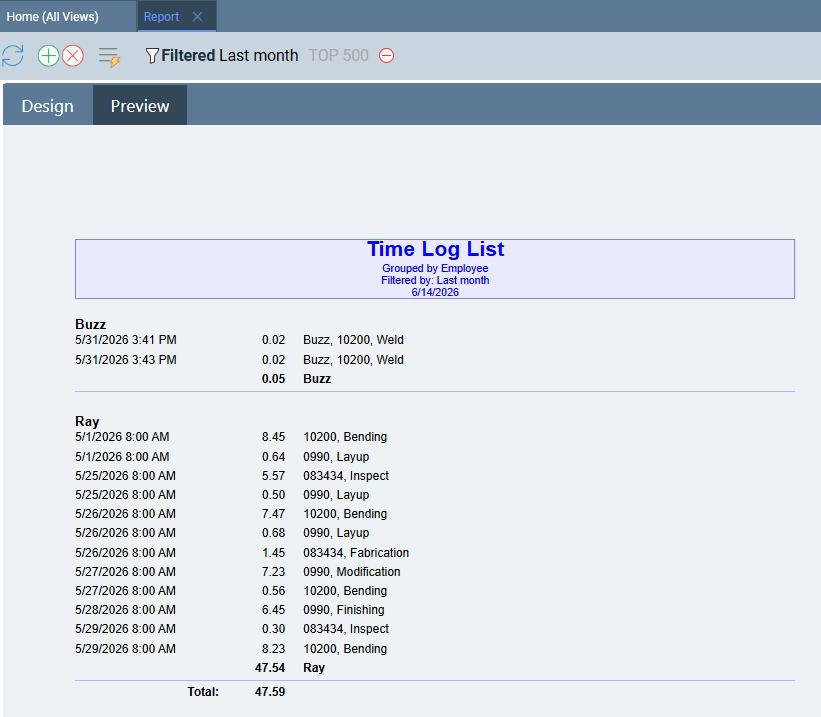
Standard Time® also includes a Reports menu with a set of pre-built report templates. These were the primary reporting tool in earlier versions of the software — before the Time Logs page gained its current filtering, column, and export capabilities. They are still available and useful in specific situations, but most day-to-day reporting is now done from the Time Logs page instead.

Standard Time® Reports menu ribbon showing icons for the available legacy report types

Each report in the menu opens a results page with its own layout — fixed columns, a dedicated filter bar, and print or export options. The results look different from the Time Logs grid but pull from the same underlying data.

Legacy Reports results page in Standard Time® showing a pre-built report with fixed columns and a summary layout
When to use Legacy Reports: The Reports menu shines when you need a heavily customized output — custom SQL-style filter scripts, specific column arrangements not available in the Time Logs grid, or a printed layout formatted for handoff to a client or auditor. For everyday hour review, payroll prep, and exports to Excel or Google Sheets, the Time Logs page is faster and more flexible.
Why Time Logs is now the go-to: The Time Logs page has absorbed most of what once required a legacy report — dynamic date range presets, add/remove columns, grouped totals, and one-click export to Excel or Google Sheets. The Reports menu remains available for advanced use cases and for users who have existing report configurations they rely on, but new reporting workflows are best built on Time Logs.
Related articles and FAQ:

Back to Learning Center

Ready to Run Your First Report?

Start a free 30-day trial and see exactly where your shop floor hours are going.

View Pricing Contact Us