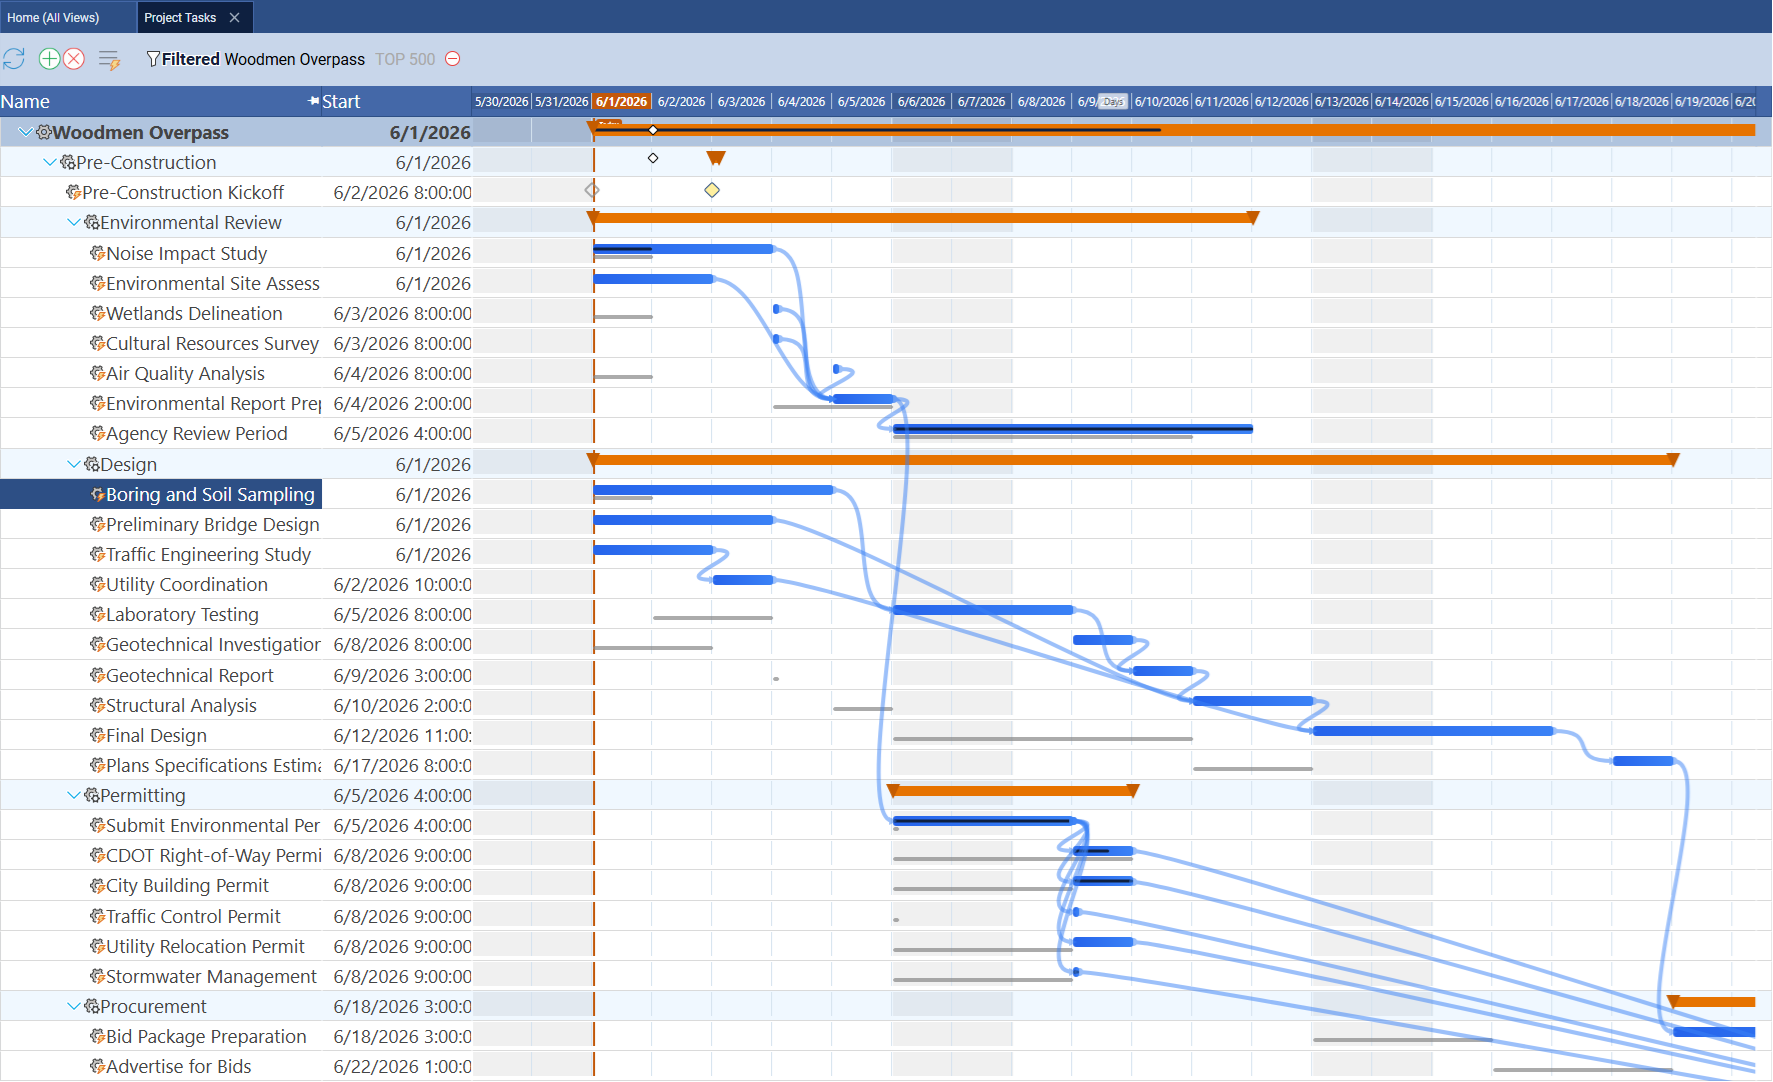
What the Gantt Chart Shows
The Gantt chart is the rightmost column on the Project Tasks page. Every row in the task grid corresponds to a bar (or milestone diamond) on the timeline. The chart gives you a visual representation of:
- Start and finish dates — each bar spans from its task's start date to its finish date
- Task hierarchy — summary bars represent parent tasks; child task bars are indented below them
- Dependencies — curved link lines connect predecessor bars to their successors
- Progress — a thin fill strip at the bottom of each bar shows percent complete
- Critical path — tasks with zero schedule float are highlighted in red
- Float — non-critical tasks show a lighter bar extension indicating how much slack they have
- Baseline — a ghost bar beneath the current bar shows where the task was scheduled when the baseline was taken

The Gantt Scale — Dates and Zoom
The scale header across the top of the Gantt column is the date ruler. It shows the date intervals that align with each vertical grid line, and it contains the navigation and zoom controls.

Zoom levels
Standard Time® supports five zoom levels. The zoom level controls how wide each cell in the scale header is and how many pixels per day each bar receives:
- Days — one cell per day; weekend cells are shaded to distinguish Sat/Sun from weekdays
- Weeks — one cell per Monday-to-Sunday week
- Months — one cell per calendar month
- Quarters — one cell per quarter (Jan–Mar, Apr–Jun, Jul–Sep, Oct–Dec)
- Years — one cell per year
Changing the zoom level
There are two ways to zoom in or out:
- Drag the resize handle — each cell boundary in the scale header has a narrow green drag handle (4px wide). Drag it left to compress the timeline (zoom out) or right to expand it (zoom in). The zoom label updates as you drag.
- Mouse wheel over the scale — scroll up to zoom in, scroll down to zoom out.
Navigating left and right
Use the arrow buttons on the left and right ends of the scale header to scroll the timeline. The buttons appear when you hover over the scale header:
- The single-arrow buttons ( / ) scroll by one interval — one day in Days mode, one week in Weeks mode, one month in Months mode, and so on.
- The double-arrow buttons ( / ) scroll by one full visible page width — a fast jump across many months or years.
- The circle button () scrolls the chart to the earliest start date among currently selected task rows — useful for finding a task you have selected in the grid but whose bar is off-screen.
You can also hold any arrow button down to auto-scroll continuously — the scroll accelerates after a short hold delay.
Dragging anywhere in the Gantt column that is not on a bar also pans the timeline left or right.
Task Bar Types
The Gantt chart uses different bar shapes and colors depending on the type and status of each task.

Task bars (regular)
A standard task bar is a colored rectangle. Its left edge is the start date and its right edge is the finish date. Blue bars are non-critical tasks with available float. Red bars are on the critical path — any delay pushes the project end date.
Summary bars
Summary bars represent parent tasks that contain sub-tasks. They render as a gold/brown thick bar with downward-pointing triangles at each end to visually distinguish them from regular task bars. Summary bars span from the earliest start of any child task to the latest finish. Small diamond markers on the summary bar indicate milestone dates of children below.
Milestone diamonds
Milestones are zero-duration tasks — they mark a single point in time (a deadline, a handoff, a gate review). They render as a diamond shape (a rotated square) rather than a bar. Milestone diamonds are draggable just like bars.
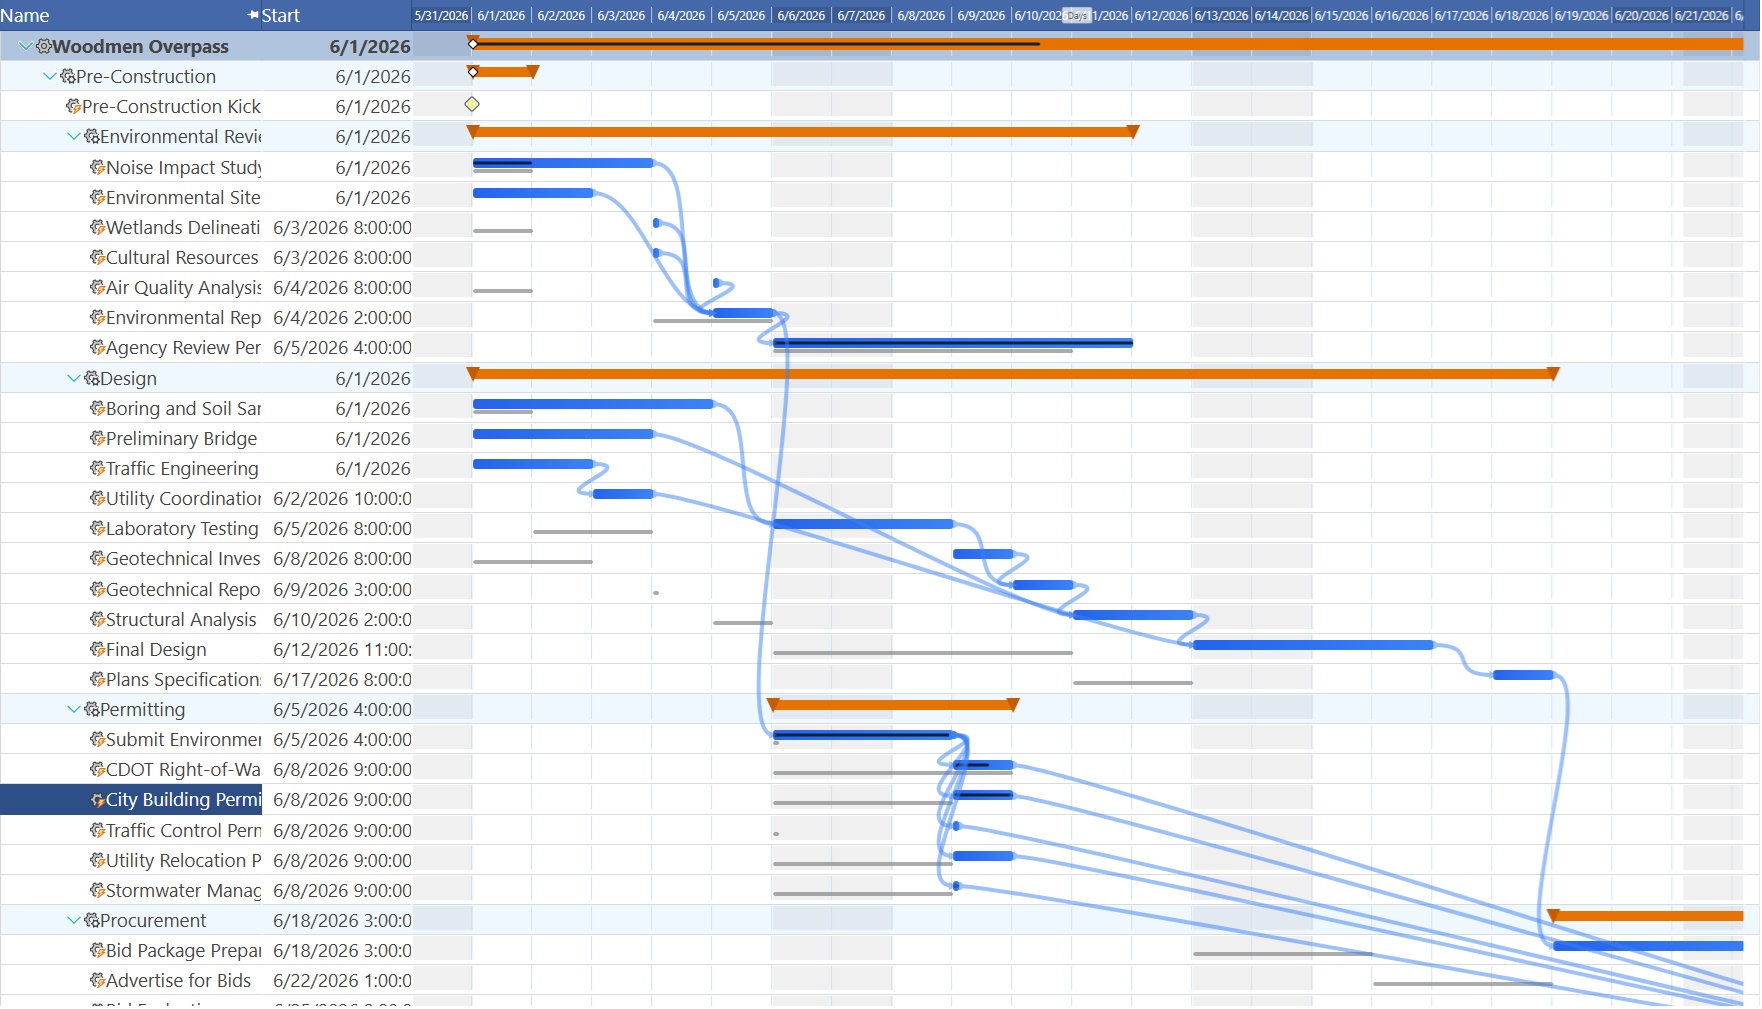
The Today Line
A vertical dashed orange line marks today's date on the Gantt chart. It updates automatically — every time you open the page, the line is positioned at the current date regardless of what day you last visited.
The first row of the chart shows a small "Today" label at the top of the line to make it easy to orient yourself when the current date is not near any bar. The today line appears in every scale mode — Days, Weeks, Months, Quarters, and Years.
Percent Complete
Each task bar shows a thin fill strip anchored to the bottom of the bar. The strip's width is proportional to the task's Percent Complete value — a 50%-complete task shows a strip that fills half the bar width; a 100%-complete task fills the entire width.
This strip is a dark shade of the bar color, so it is visible on both critical (red) and non-critical (blue) bars. Milestones and summary bars do not show a percent strip.
To update percent complete, click any task row to open the Properties panel on the right side of the window, then change the Percent Complete field. The bar fill updates immediately on the Gantt chart.
Dragging Bars to Reschedule
Every Gantt bar is draggable. You can move tasks on the timeline with the mouse — no need to open a dialog or type new dates.
Moving the start date (drag the bar)
- Hover over any task bar until the cursor changes to a move cursor.
- Click and hold, then drag left or right.
- A date label appears on the bar as you drag, showing the new start date in real time.
- Release to drop the bar at the new start date. Standard Time® saves the new start date immediately.
Changing the finish date (drag the resize handle)
A narrow resize handle sits at the right edge of each task bar. Dragging it left or right changes the finish date (and therefore the duration) without moving the start date. The same live date label appears during the drag.
Dragging the scale (pan)
Dragging anywhere in the Gantt column that is not on a bar pans the timeline left or right. This is the fastest way to scroll the chart when you have many tasks and need to navigate across weeks or months.
Float Bars and Schedule Slack
Total float is how much a task can slip before it delays the project end date. Standard Time® shows float as a lighter bar immediately to the right of each non-critical task bar.
The float bar label shows the float in days (e.g. 5.0 d float) or weeks (e.g. 1.4 wk float) when float exceeds seven days. Tasks on the critical path have zero float, so no float bar appears.
Float bars are rendered only when the Show Float option is enabled. They are purely informational — you cannot drag a float bar to set a date.
Task Links and Dependencies
When two tasks are linked, Standard Time® draws a curved bezier line from the predecessor bar to the successor bar. The line starts at the relevant edge of the predecessor and ends with an arrowhead at the relevant edge of the successor — which edge depends on the link type (see below).
- Blue link lines connect two non-critical tasks or a non-critical predecessor to a non-critical successor
- Red link lines connect two critical-path tasks — both the predecessor and successor are on the critical path
- Hovering over a link line highlights it and also highlights the predecessor and successor bars at both ends
- Hovering over a bar highlights all link lines connected to that bar
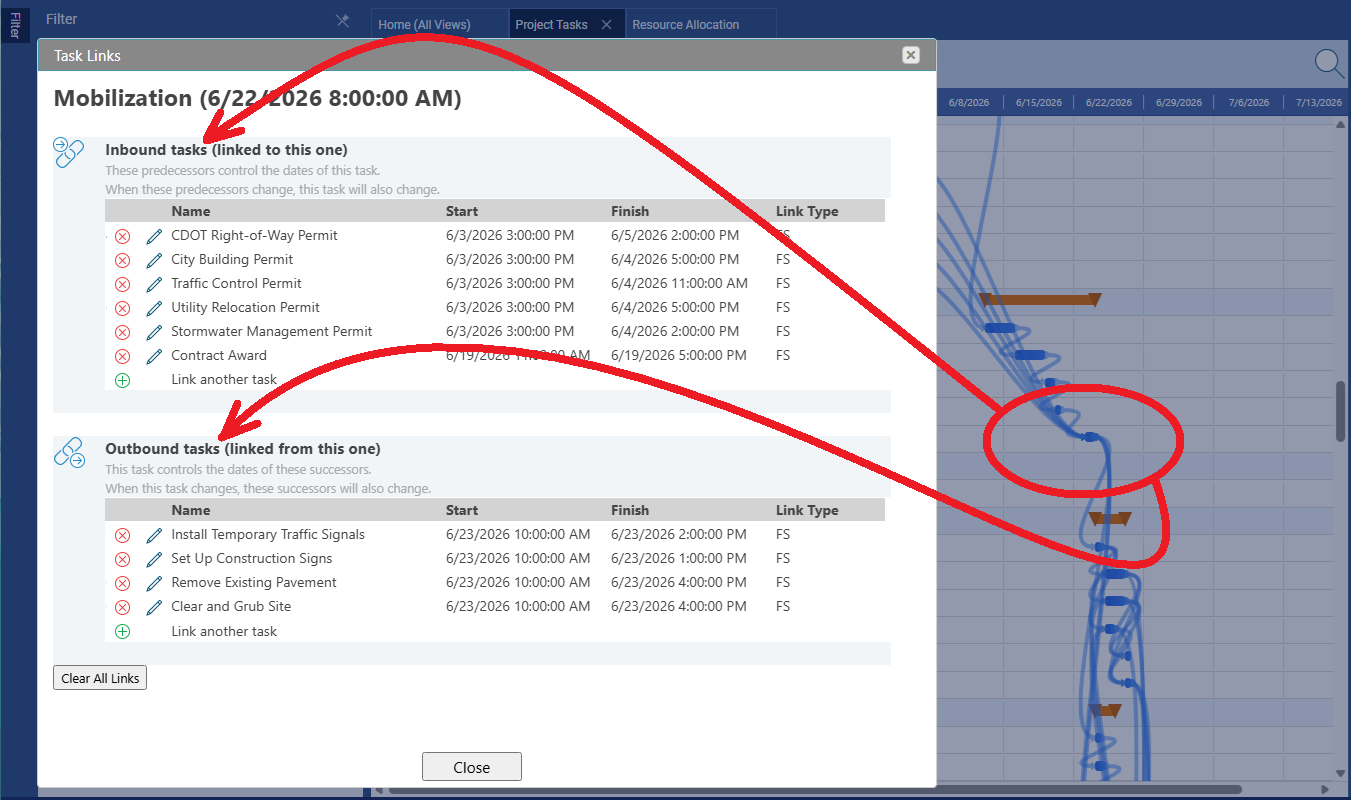
Editing task links — the Task Links dialog
Right-click any task bar on the Gantt chart (or right-click the task row in the grid) to open the context menu, then choose Task Links. The dialog shows two sections:
- Inbound tasks (predecessors) — tasks that control this task's dates. When a predecessor changes, this task will also change.
- Outbound tasks (successors) — tasks this task controls. When this task changes, its successors will also change.
Each row in the dialog shows the linked task's name, start date, finish date, and link type. Use the Link another task button (green +) to add a new dependency, the pencil icon to change the link type, or the red X to remove a link. A Clear All Links button removes every dependency for the selected task at once.
Link Relationship Types (FS, SS, FF, SF)
Standard Time® supports all four standard dependency relationship types used in project scheduling. The link type determines which edge of each bar the curved line connects to.

The link type is set in the Task Links dialog. Click the pencil icon next to any linked task row to change its type. The Gantt link line updates immediately to reflect the new connection geometry.
Critical Path
The critical path is the longest chain of dependent tasks from project start to project end. Any delay to a task on the critical path delays the project's completion date by the same amount — there is no schedule slack to absorb it.

How Standard Time® calculates the critical path
Standard Time® uses the Critical Path Method (CPM) — a two-pass calculation over the task network:
- Forward pass — computes the earliest start and finish dates for every task, working from the first task to the last
- Backward pass — computes the latest start and finish dates without delaying the project, working backward from the last task
- The difference between each task's latest and earliest start is its total float. Tasks with zero total float are on the critical path.
Recalculating the critical path
Right-click any task row and choose Recalculate Critical Path from the context menu. Standard Time® re-runs the CPM engine over all tasks in the project and updates bar colors, link line colors, float values, and float bars immediately.
Baseline Comparison
A baseline is a snapshot of the project schedule taken at a point in time — typically when the project is approved and ready to start. Once a baseline is set, Standard Time® renders a thin ghost bar below each task bar showing where the task was scheduled when the baseline was taken.
Reading the baseline bars
- A gray bar rendered below the current task bar is the baseline position
- If the current bar and the baseline bar are aligned, the task is running on schedule
- If the current bar has shifted right of the baseline bar, the task has slipped — it started or will finish later than planned
- Milestone baseline markers appear as ghost diamond outlines at the snapshotted date — if the milestone has moved, the outline sits to the left of the current diamond
Setting and clearing a baseline
Right-click any task row (or the project row in the Projects grid) and choose Set Baseline from the context menu. Standard Time® snapshots the current start, finish, duration, and percent complete for every task in the project. To remove the baseline, choose Clear Baseline from the same menu.
How to Open the Gantt Chart
The Gantt chart is built into the Project Tasks page. There is no separate Gantt view — the chart column appears automatically on the right side of the task grid whenever a project with tasks is loaded.
- From the Home screen, click Project Tasks in the navigation tabs.
- In the Filter panel on the left, select the project you want to view (or click a folder to filter by group).
- Right-click any column header in the task grid and choose Insert Column > Gantt to add the Gantt column if it is not already visible.
- The task grid loads with the Gantt column on the right. Bars appear for every task that has both a start and finish date.
- Use the scale header controls to zoom and navigate to the date range you need.
The Gantt chart also responds to the folder filter. If you filter the page by a project folder, only tasks from projects in that folder appear — the chart scope narrows to match. See What Folders Can Do For You for details on folder filtering.